
This is a guest post by Eduardo Castro. To detect performance problems in SQL Server, start with the DMVs that show where the time goes.

 Eduardo Castro is a database expert and a partner at Linchpin People. Eduardo shares here the DMV queries that point to the origin of a performance problem.
Four Places to Look First
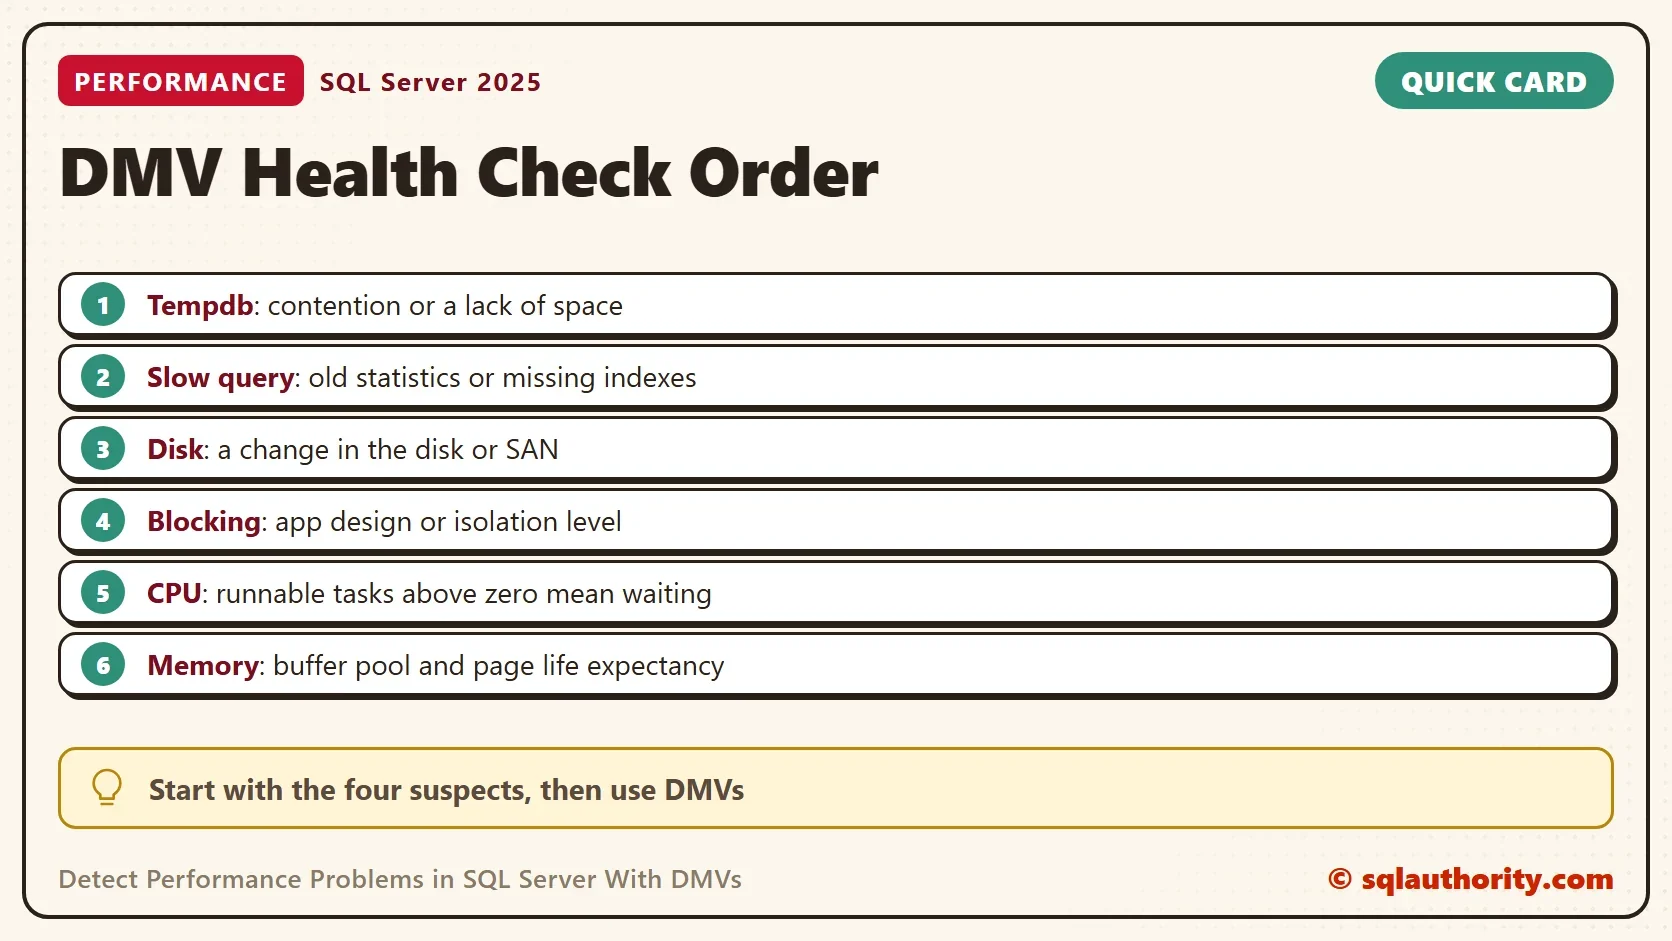
This article has T-SQL scripts and DMVs that detect performance problems in SQL Server. They help you see where a problem starts. A DMV, short for dynamic management view, is a built-in view of the server’s own state. When you optimize a SQL Server instance, review these four areas first.
The first is tempdb. Each instance has a unique tempdb, and it can suffer contention or a lack of space. A poorly built T-SQL statement that uses tempdb heavily can hurt every other application and database that uses it. The second is a query that runs slowly. An existing query slows down when statistics are stale, indexes were never rebuilt, or a missing index causes scans.
The third is the disk or the SAN. A change in the type of disk affects performance. The fourth is blocking. Once the queries are optimized, blocking is the next cause. It comes from poor design or an unsuitable isolation level. Based on these causes, I will show some DMVs that detect performance problems in SQL Server.
CPU: Are Tasks Waiting for a Scheduler?
To see whether you have a CPU problem, use the DMV sys.dm_os_schedulers. It gives you information about the schedulers in SQL Server. In an environment without performance issues, the runnable task counts of this DMV tend to be zero. A value above zero means that tasks are waiting to run. If the values are too high, you have a CPU capacity problem.
SELECT scheduler_id, current_tasks_count, runnable_tasks_count,
       current_workers_count, active_workers_count, context_switches_count,
       work_queue_count, pending_disk_io_count
FROM sys.dm_os_schedulers
WHERE scheduler_id < 255;
Read the values this way. The count runnable_tasks_count should be zero in most cases. The count current_workers_count is the number of workers associated with the scheduler. The count work_queue_count is the number of tasks waiting to be assigned to a worker. The count pending_disk_io_count is I/O that is waiting to complete.
Memory: The Buffer Pool
Another component to check is the buffer pool, which stores and manages the data cache of SQL Server. The DMV sys.dm_os_buffer_descriptors returns information about all pages used by the buffer pool. Each page of SQL Server is 8 KB. The page types include data pages, index pages and TEXT_MIX_PAGE. You can group the descriptors by database to see the distribution of the buffer pool. The query below returns the cache used by each database of the instance.
SELECT COUNT_BIG(*) * 8 / 1024 AS CacheUsedMb,
       CASE database_id WHEN 32767 THEN N'Resource database' ELSE DB_NAME(database_id) END AS DatabaseName
FROM sys.dm_os_buffer_descriptors
GROUP BY database_id
ORDER BY CacheUsedMb DESC;
To check for a lack of physical memory, look at the buffer manager counters. The stolen pages counter is the number of pages stolen from the cache to meet the demand for memory. Its value should stay stable over time. If it doesn’t, you have a problem with the amount of available physical memory. The counter Database pages is the number of pages in the cache, and it is stable. Abrupt changes mean that the cache is being swapped, which is another sign that the server needs more memory.
SELECT RTRIM(SUBSTRING(object_name, CHARINDEX(N':', object_name) + 1, 60)) AS CounterGroup,
       RTRIM(counter_name) AS CounterName, cntr_value AS CounterValue
FROM sys.dm_os_performance_counters
WHERE (object_name LIKE N'%:Buffer Manager%'
       AND counter_name IN (N'Page life expectancy', N'Database pages', N'Buffer cache hit ratio', N'Buffer cache hit ratio base'))
   OR (object_name LIKE N'%:Memory Manager%' AND counter_name = N'Stolen Server Memory (KB)')
ORDER BY CounterGroup, CounterName;
The counter Buffer cache hit ratio shows the percentage of pages found in memory, so higher is better. The counter Page life expectancy is the average number of seconds that a page stays in the cache. For OLTP systems, an average of 300 seconds, which is five minutes, is the usual line. A lower value can point to a memory problem.
The system_health Session
Since SQL Server 2008, an Extended Events session named system_health helps you troubleshoot the performance of the database engine. The first query below shows that the session runs and which targets hold its data. To read the events, cast the column target_data of the target to xml.
SELECT s.name AS SessionName, t.target_name AS TargetName
FROM sys.dm_xe_sessions AS s
JOIN sys.dm_xe_session_targets AS t ON t.event_session_address = s.address
WHERE s.name = N'system_health'
ORDER BY t.target_name;
The XML holds information about memory, latches, waits and more. If the SQL Server engine has problems, review it.
What to Remember
Work through the four suspects: tempdb, a slow query, the disk and blocking. Use the scheduler DMV for CPU and the buffer pool views for memory. Each DMV answers one question in a few lines.
To detect performance problems early, take these readings regularly. A runnable task count of zero is good news. If it changes, you know where to look.
Note from Pinal: These scripts run on SQL Server 2025. They need VIEW SERVER STATE, called VIEW SERVER PERFORMANCE STATE from SQL Server 2022. The counter Stolen pages is now Stolen Server Memory (KB) in the Memory Manager group. The 300 second line is old, so compare page life expectancy with your own baseline. For slow queries, disk delay, tempdb space and blocking, start with four views: sys.dm_exec_query_stats, sys.dm_io_virtual_file_stats, sys.dm_db_file_space_usage and sys.dm_os_waiting_tasks.
A DMV is not an answer, it is a question you ask on a schedule.
Published by Pinal Dave on SQLAuthority. More of my work at pinaldave.com.
Discover more from SQL Authority with Pinal Dave
Subscribe to get the latest posts sent to your email.




2 Comments. Leave new
Please check your queries before posting them
> WHEN 32767 THEN database_id ‘BD Resources’
> WHERE OBJECT_NAME = ‘SQLServer: Buffer Manager’
Attention to detail, shipmate. Check the syntax of the example code.
1) “amount of cache used by each database” won’t compile
2) WHERE OBJECT_NAME = ‘SQLServer: Buffer Manager’ should be WHERE OBJECT_NAME = ‘SQLServer:Buffer Manager’