[Note from Pinal]: This is a new episode of Notes from the Field series. We build our business application with zeal and enthusiasm. We believe it will do well for many years but it is not the case always. After a while performance started to go down and everything is not in the best shape. We often suffer from unknown SSAS performance issues in our application which we are not even aware of.

In this episode of the Notes from the Field series I asked SQL Expert Bill Anton a very crucial question – How to we know if our application is suffering from unknown SSAS performance issue? Bill was very kind to answer the questions and provides plenty of information about how a novice developer can work with SSAS.
Ever wondered what’s actually happening on your Analysis Services server? If so, then you’re certainly not alone. Many DBAs think of Analysis Services as this black box implemented by a crazy group of Business Intelligence developers and then left behind once the developers move on to the next project. Down the road, when a performance issue arises, whether it’s a new report taking a long time to load or an issue with the nightly processing job, it’s up to the DBA to try and resolve the issue. There’s just one problem – the DBA hasn’t had the training necessary to know where to start looking.
As a BI consultant I see this situation all the time. So in this post, I’m going to show you how to take the first step in troubleshooting Analysis Services performance issues – which is to run an extended events trace on your Analysis Services server to see what’s actually happening.
Running an Extended Events Trace
Extended Events (xEvents) is an event-handling system providing insight to the behavioral and performance characteristics of an Analysis Services instance. Even though it was first introduced for the database engine in SQL Server 2008, it didn’t make its way into Analysis Services until SQL Server 2012. However, it is the successor to SQL Profiler (which is has been deprecated) so unless you’re still working with SSAS 2008R2 (or below), it’s time to get comfortable w/ xEvents.
Because there’s no GUI with xEvents for Analysis Services (definitely one of the major deterrents for newcomers) you’ll have to use XMLA commands to start and stop the trace.
Note: to save you time, all scripts shown in the examples below can be downloaded from the link at the bottom of this post.
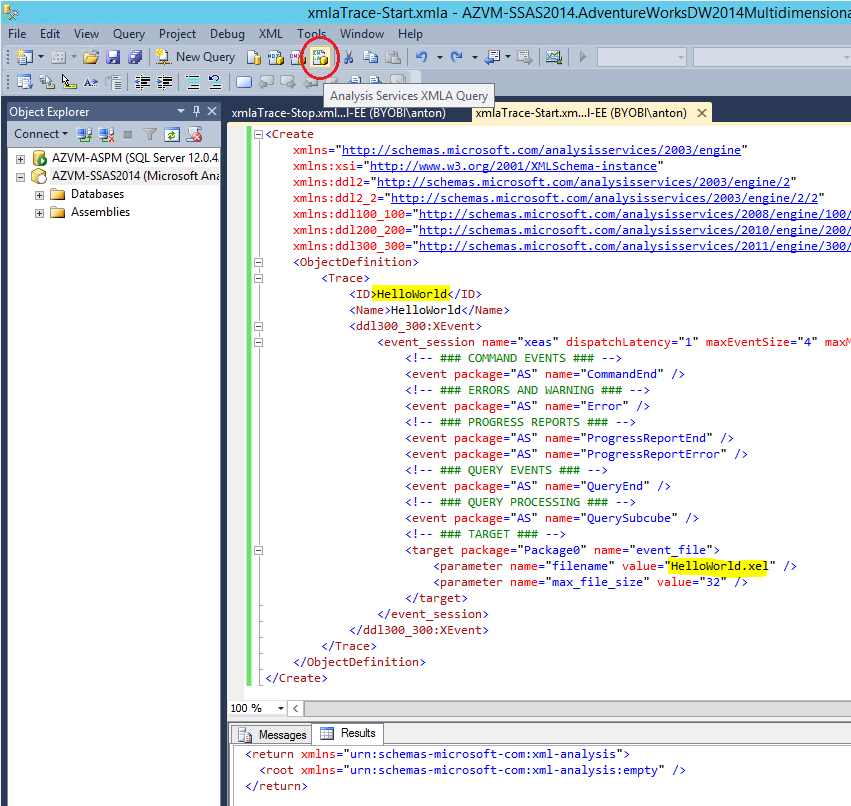
To start the trace, you can simply open SSMS, connect to the Analysis Services instance, open an Analysis Services XMLA query window (circled in the screenshot below), paste in the command, and hit execute.

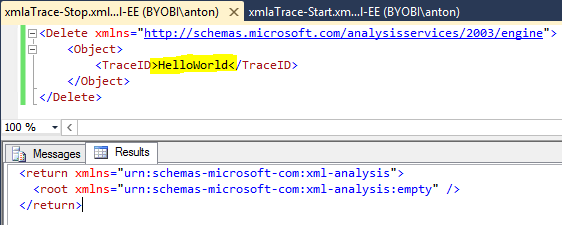
When you’re ready to stop the trace, you can execute the following XMLA command…

Once the trace is stopped you can find the output file in the default Analysis Services log directory…

Note: if you want the output files to be written out to another directory then you will need to specify the full filepath for the filename parameter in the XMLA command to start the trace. You’ll also need to make sure that the Analysis Services service account has the correct permissions for the directory you specify.
Now that we have the trace output, let’s focus on how to extract information from the trace file.
Analyzing an Extended Events Trace
The trace we ran in the previous section contains tons of useful information.
Query-Related
For queries we can see every query executed on the system including the total duration, query text, start/end time, as well as the name of the user who ran the query. It also contains information about the execution of the query (which may be more than you care to know) such as the amount of time spent in the Formula Engine vs the Storage Engine, number of partition scans, number of aggregation hits, number of cache hits – all of which can be helpful when troubleshooting slow query performance.
Processing-Related
If the trace is running while the SSAS database is being processed we can see total processing duration as well as the processing duration by major object (e.g. cube, measure group, partition, aggregation, dimension, etc) – which can be very helpful when determining where to focus your effort as the cube grows and the time it takes to process begins to approach the end of the processing window.
However, before we can start tapping into all of this wonderful information, we first need to load the data from the trace file into a SQL Server table.
The most common way to do this is by using the sys.fn_xe_file_target_read_file function. The statement below uses this function to read in the trace file, shred the (XML) contents, and write the flattened results into a temp table named #xevent_raw_trace_data.

With the data in a table, we’re ready to start extracting useful information.
Below are a few examples to help get you started. They provide some of the more common types of information you’ll want to know about the query activity happening on the server.
Example 1 – number of queries and average query duration by application and user
This query is useful to see who your heaviest users are, which application they’re using most, and what the user experience is like in terms of query performance. For example, if you see a user with a high query count and a high average query duration (e.g. > 30 seconds), it’s probably worth checking up on them to see what they’re trying to do and if there’s a better way for them to do it.

Example 2 – queries that took longer than 10 seconds to complete
This query will show you the worst performing MDX and/or DAX queries are generated by your users. It is one of my favorites and I recommend clients review the results on a regular basis. Typically, what you’ll see is that there are a small handful of users (or applications) that make up the bulk of the slow queries. Those are the users/applications where you’ll want to focus your time and energy in order to have the biggest impact on the overall performance and user experience.

Example 3 – query execution details
This one starts to get a bit more complicated. You might use this query after you’ve isolated a slow MDX/DAX query (from the previous example) and you want to start digging deeper.

Conclusion
Extended events traces are the key to unlocking the mystery of what’s going on inside your Analysis Services server. They are the successor for SQL Profiler and should be part of any decent Analysis Services Performance Monitoring solution.
It might not be pretty (few things are when it comes to XML), but like it or not, extended events are here to stay. Fortunately, it looks like Microsoft will be adding an extended events GUI in Analysis Services 2016.
Here’s the download link to the XMLA scripts and SQL queries shown in this post to help get you started.
If you want to get started on performance monitoring with SSAS with the help of experts, read more over at Fix Your SQL Server.
Reference: Pinal Dave (https://blog.sqlauthority.com)


3 Comments. Leave new
It doesn’t appear that the download link is one. It links to another blog posting without a download.
Not able to download ?
on SSAS 2014 got trace to run but with function get the error below
Executing the query … 01.
Query (27, 120) Parser: The syntax for ‘DATE’ is incorrect.
Run complete 01.
Executing the query … 11.
Parser: The following syntax error occurred during parsing: Invalid token, Line 6, Offset 6, #.
Run complete 11.