The Spatial results tab in SSMS draws every geometry value a query returns, so T-SQL can make a picture. That sounds like a toy, and it is a fun one. It is also the fastest check for spatial data. A wrong shape is obvious on screen and invisible in a grid of hex digits.

Where the Spatial Results Tab Appears
SQL Server has two spatial types. The geography type describes places on the round earth, with latitude and longitude. The geometry type describes a flat plane with plain x and y numbers. The demo uses geometry. A geometry value is a point, a line, a polygon or a collection of them.
Run a query in Results to Grid that returns a geometry column. SSMS 22 adds a Spatial results tab next to the Results and Messages tabs. The grid shows only a long binary value for the shape. The Spatial results tab draws the shape itself.
The demo database is named SpatialArtDemo and exists for this post only, so run it on a test server. The first script creates a table with one geometry column and a Label column for the names of the shapes.
IF DB_ID(N'SpatialArtDemo') IS NULL CREATE DATABASE SpatialArtDemo;
GO
USE SpatialArtDemo;
GO
DROP TABLE IF EXISTS dbo.Drawing;
CREATE TABLE dbo.Drawing (
    ShapeID int IDENTITY(1,1) NOT NULL PRIMARY KEY,
    Label   nvarchar(20) NOT NULL,
    Shape   geometry     NOT NULL
);
Draw a House and a Tree
Every shape comes from either well-known text or a method call. Well-known text is a plain string such as POLYGON((2 0, 8 0, 8 5, 2 5, 2 0)). The first and last corner of a polygon must match, which closes it. The house is a rectangle, the roof is a triangle, and the door and window are smaller rectangles.
Round shapes come from STBuffer. A point has no size, and STBuffer(2) returns a polygon holding every location within 2 units of it. That is a circle drawn with many short straight edges. The sun and the leaves of the tree are buffered points, and the trunk is one more rectangle.
INSERT INTO dbo.Drawing (Label, Shape)
VALUES (N'ground', geometry::STGeomFromText('LINESTRING(0 0, 16 0)', 0)),
       (N'house', geometry::STGeomFromText('POLYGON((2 0, 8 0, 8 5, 2 5, 2 0))', 0)),
       (N'roof', geometry::STGeomFromText('POLYGON((1.5 5, 8.5 5, 5 8.5, 1.5 5))', 0)),
       (N'door', geometry::STGeomFromText('POLYGON((4.2 0, 5.8 0, 5.8 3, 4.2 3, 4.2 0))', 0)),
       (N'window', geometry::STGeomFromText('POLYGON((6.2 2.5, 7.4 2.5, 7.4 3.7, 6.2 3.7, 6.2 2.5))', 0)),
       (N'sun', geometry::Point(1, 9, 0).STBuffer(0.8)),
       (N'trunk', geometry::STGeomFromText('POLYGON((12.7 0, 13.3 0, 13.3 3, 12.7 3, 12.7 0))', 0)),
       (N'leaves', geometry::Point(13, 4.5, 0).STBuffer(2));
Before you draw, ask the database what it holds. STIsValid confirms that each polygon follows the rules, STArea measures it, and STLength gives the perimeter. The house covers 30 square units, because it is 6 wide and 5 tall.
SELECT ShapeID, Label, Shape.STGeometryType() AS ShapeType, Shape.STIsValid() AS IsValid,
       CAST(Shape.STArea() AS decimal(8,2)) AS Area, CAST(Shape.STLength() AS decimal(8,2)) AS Perimeter
FROM dbo.Drawing
ORDER BY ShapeID;| ShapeID | Label | ShapeType | IsValid | Area | Perimeter |
|---|---|---|---|---|---|
| 1 | ground | LineString | 1 | 0.00 | 16.00 |
| 2 | house | Polygon | 1 | 30.00 | 22.00 |
| 3 | roof | Polygon | 1 | 12.25 | 16.90 |
| 4 | door | Polygon | 1 | 4.80 | 9.20 |
| 5 | window | Polygon | 1 | 1.44 | 4.80 |
| 6 | sun | Polygon | 1 | 2.01 | 5.03 |
| 7 | trunk | Polygon | 1 | 1.80 | 7.20 |
| 8 | leaves | Polygon | 1 | 12.56 | 12.57 |
The leaves are a circle of radius 2, so the exact area is about 12.57. STBuffer returns 12.56, slightly less, because its edges are straight. The line has no area, which is why the ground shows 0.00.
Now return the shapes and the labels in one result set. Open the Spatial results tab after the query finishes.
SELECT Label, Shape FROM dbo.Drawing ORDER BY ShapeID;
Pick a Label and Stay Under the Limit
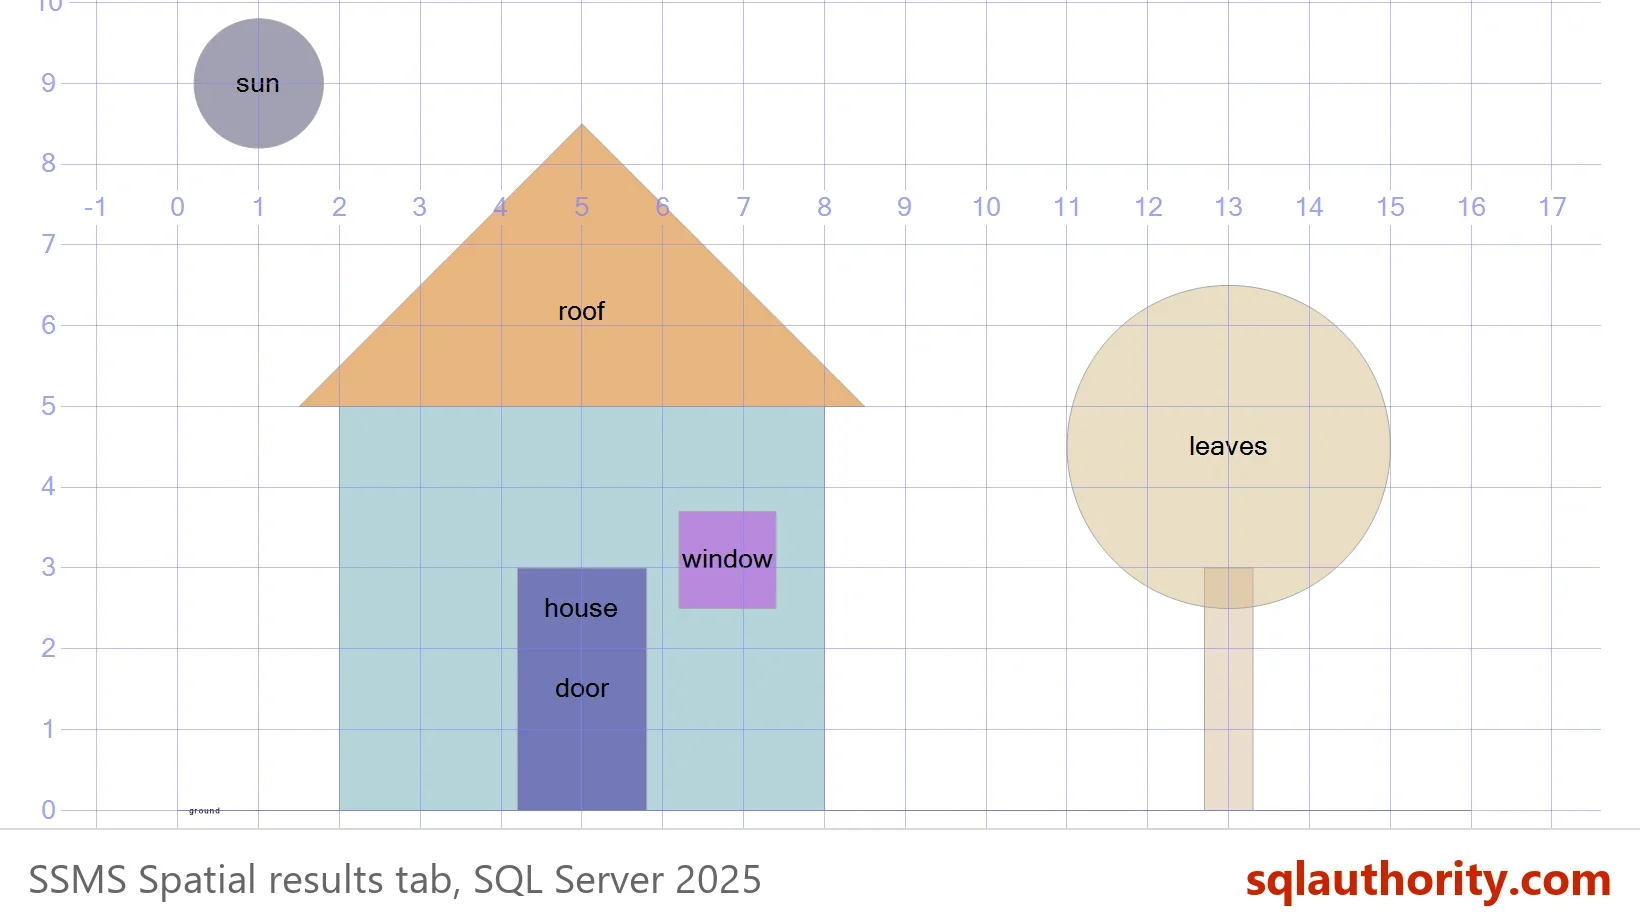
The tab has a list for the spatial column to draw. A result set with two geometry columns shows one at a time. A second list chooses the label column, and the tab prints that column’s value on each shape. Choose Label here and the shapes name themselves. In SSMS 22 the names can stay hidden until the view repaints, and moving the Zoom slider does it. The picture shows three zoom steps up with grid lines on.
Look closely at the labels. The house label sits over the door, because SSMS writes it at the center of the house shape. The narrow trunk gets no label, and the ground label is a tiny mark at the origin.
The tab draws at most 5,000 objects from one result set. A query that returns more shows only part of the data, and the picture then looks wrong without any error. Filter with WHERE, take a TOP slice, or merge many shapes into one with geometry::UnionAggregate before you draw them.
A shape with no area, such as the ground line, is still drawn as a line. An invalid polygon is a different story. Check STIsValid first, since an invalid shape gives wrong areas and wrong intersections, and the picture hides the cause.
A Real Use: Store Service Areas
The same tab checks business data. A juice bar chain serves everyone within 3 miles of each store. The table below holds four stores on a grid where one unit is one mile. Each service area is the store location buffered by 3.
DROP TABLE IF EXISTS dbo.StoreArea;
CREATE TABLE dbo.StoreArea (
    StoreID   int          NOT NULL PRIMARY KEY,
    StoreName nvarchar(40) NOT NULL,
    Location  geometry     NOT NULL,
    Area      geometry     NOT NULL
);
INSERT INTO dbo.StoreArea (StoreID, StoreName, Location, Area)
SELECT v.StoreID, v.StoreName, p.Pt, p.Pt.STBuffer(3)
FROM (VALUES (1, N'Elm Street Juice Bar', 3.0, 4.0),
             (2, N'Harbor Juice Bar', 7.0, 5.0),
             (3, N'Mill Road Juice Bar', 11.0, 4.0),
             (4, N'Hilltop Juice Bar', 8.0, 12.0)) AS v(StoreID, StoreName, X, Y)
CROSS APPLY (SELECT geometry::Point(v.X, v.Y, 0) AS Pt) AS p;
Which service areas overlap? STIntersects answers yes or no, and STIntersection returns the shared piece, whose area you can measure. Two pairs of neighboring stores share 5.65 square miles each.
SELECT a.StoreName AS StoreA, b.StoreName AS StoreB,
       CAST(a.Area.STIntersection(b.Area).STArea() AS decimal(8,2)) AS SharedArea
FROM dbo.StoreArea AS a
JOIN dbo.StoreArea AS b ON b.StoreID > a.StoreID AND a.Area.STIntersects(b.Area) = 1
ORDER BY a.StoreID, b.StoreID;| StoreA | StoreB | SharedArea |
|---|---|---|
| Elm Street Juice Bar | Harbor Juice Bar | 5.65 |
| Harbor Juice Bar | Mill Road Juice Bar | 5.65 |
Next, test three customers. Priya lives where two areas overlap. Noah and Maya live outside every area, and the LEFT JOIN keeps them in the result with a NULL store.
SELECT c.CustomerName, s.StoreName
FROM (VALUES (N'Priya', 5.0, 5.0), (N'Noah', 9.0, 9.0), (N'Maya', 14.0, 12.0)) AS c(CustomerName, X, Y)
LEFT JOIN dbo.StoreArea AS s ON s.Area.STIntersects(geometry::Point(c.X, c.Y, 0)) = 1
ORDER BY c.CustomerName, s.StoreName;
| CustomerName | StoreName |
|---|---|
| Maya | NULL |
| Noah | NULL |
| Priya | Elm Street Juice Bar |
| Priya | Harbor Juice Bar |
Draw the whole picture by returning the service areas and the customers, shown as small circles, in one result set. The gap around Noah and Maya is visible at a glance. That is what the tab is best at: a question you would otherwise have to read as numbers.
SELECT StoreName AS Label, Area AS Shape FROM dbo.StoreArea
UNION ALL
SELECT N'customer ' + c.CustomerName, geometry::Point(c.X, c.Y, 0).STBuffer(0.25)
FROM (VALUES (N'Priya', 5.0, 5.0), (N'Noah', 9.0, 9.0), (N'Maya', 14.0, 12.0)) AS c(CustomerName, X, Y);
One more number answers a planning question. UnionAggregate merges the four areas into one shape, so the overlap is counted once. The areas total 113.05 square miles if you add them, and the union covers 101.76.
SELECT CAST(geometry::UnionAggregate(Area).STArea() AS decimal(8,2)) AS CoveredArea,
       CAST(SUM(Area.STArea()) AS decimal(8,2)) AS AreaIfNoOverlap
FROM dbo.StoreArea;| CoveredArea | AreaIfNoOverlap |
|---|---|
| 101.76 | 113.05 |
When a Map Tool Is the Better Choice
You could argue that a real mapping tool does all of this better. For a finished map it does, with streets, labels and colors. The Spatial results tab is a check, not a product. It shows the shape your query made, and it needs nothing installed beyond SSMS.
The demo uses geometry, a flat plane, so distances are in the units you chose. Real latitude and longitude need the geography type, which measures on the curved earth and returns distances in meters. A flat grid is the right tool for a floor plan, a game board or a toy house.
What to Remember
Return the geometry column and a Label column, and open the Spatial results tab. Run STIsValid before you trust a shape. Keep each result set under 5,000 objects, and merge shapes with UnionAggregate when you have more.
When I test a spatial query, I draw it before I read a single number. A wrong buffer distance or a swapped x and y looks wrong immediately. When you finish testing, remove the example database.
USE master;
GO
ALTER DATABASE SpatialArtDemo SET SINGLE_USER WITH ROLLBACK IMMEDIATE;
DROP DATABASE SpatialArtDemo;
A shape that returns no error is not proof, it is a picture waiting to be looked at.
Published by Pinal Dave on SQLAuthority. More of my work at pinaldave.com.
Discover more from SQL Authority with Pinal Dave
Subscribe to get the latest posts sent to your email.