VAR and VARP answer different variance questions for the same numeric observations. I choose the population or sample interpretation first. A matching input list does not make their denominators interchangeable.

Use a small group with visible arithmetic
The first group supplies readings two, four and six, plus one missing reading. Its mean among present observations is four. The squared deviations are four, zero and four.
Those squared deviations sum to eight. The sample calculation divides by two, giving an expected variance of four. The population calculation divides by three, giving eight thirds.
The output casts each float result to decimal(12,6) for a compact display. The expected population display is 2.666667. That display rounding does not change which variance the function computes.
I keep the input-row count and present-reading count beside the results. Their expected values are four and three. The missing row is visible without becoming a numeric zero.
WITH Observations AS
(
    SELECT GroupId,Reading FROM (VALUES
        (1,CAST(2 AS int)),(1,4),(1,6),(1,CAST(NULL AS int)),
        (2,9),(3,CAST(NULL AS int)),(3,CAST(NULL AS int))
    ) AS v(GroupId,Reading)
)
SELECT GroupId,COUNT(*) AS InputRows,COUNT(Reading) AS PresentReadings,
    CAST(VAR(Reading) AS decimal(12,6)) AS SampleVariance,
    CAST(VARP(Reading) AS decimal(12,6)) AS PopulationVariance
FROM Observations GROUP BY GroupId ORDER BY GroupId;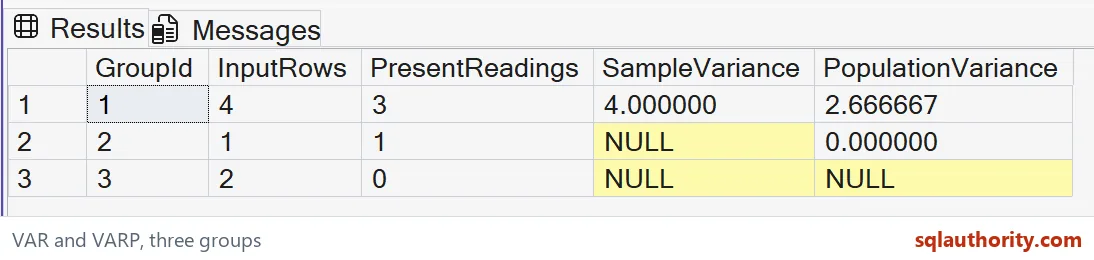
Choose the denominator from the reporting question
VAR represents sample variance with the denominator based on one fewer than the present observation count. VARP represents population variance. The choice belongs to the statistical meaning of the observations.
If these three readings are the complete population being described, the population result answers that question. If they are a sample used for the corresponding variance estimate, the sample interpretation differs. SQL cannot determine that reporting intent.
I would state the choice in a report definition rather than select whichever output looks preferable. Both calculations use the same deviations here. Their different results are a deliberate consequence of different denominators.
This example does not establish that the observations are representative or independent. Those questions require information about collection and selection. A correct aggregate expression cannot repair an unsuitable sample.

A singleton exposes an important boundary
The second group contains one present reading, nine. Its expected population variance is zero. There is no variation within that one-observation population.
Its expected sample variance is NULL. A denominator based on one fewer observation does not support a sample variance from a singleton. That result should not be casually replaced with zero.
The third group contains only missing readings. Its present-reading count is zero and both expected variance outputs are NULL. There are no numeric observations from which to calculate variation.
I retain the singleton and missing-only groups because an ordinary populated group hides those boundaries. A report must decide how to communicate insufficient observations. The calculation alone does not supply a useful display label.
Preserve observation multiplicity and missingness
The ordinary aggregate includes repeated numeric observations. Repeated measurements can be legitimate observations rather than accidental duplicates. Removing them with DISTINCT changes the dataset being described.
These aggregates ignore missing readings. Treating them as zero would be a separate source transformation. That transformation could change the mean and both variance results.
Both functions return float before the explicit display casts. This example uses small integers with simple arithmetic. It does not claim exact decimal computation for every large or approximate input.
Keep the present-observation count beside both variance columns. The singleton and missing-only groups need different explanations from an ordinary populated group. Select a report label that preserves those statistical distinctions.
Decide which question you are asking, and the denominator follows.
A variance formula is not the reporting question, it is the answer to a question you chose.
Published by Pinal Dave on SQLAuthority. More of my work at pinaldave.com.
Discover more from SQL Authority with Pinal Dave
Subscribe to get the latest posts sent to your email.