
Wait statistics help choose the next investigation, but their largest lifetime total does not identify today’s bottleneck. Start by asking what period the numbers cover. Then compare them with the workload and requests observed during the problem.

A cumulative ranking is a starting point
This query ranks cumulative wait time across wait types. Keep that cumulative result separate from a diagnosis of a particular application incident.
SELECT *
FROM sys.dm_os_wait_stats
ORDER BY wait_time_ms DESC
GO
The DMV records completed waits rather than a list of currently waiting requests. Many entries represent ordinary background activity. A high cumulative number can span substantial uptime. It needs workload context before it becomes an actionable finding.
Read wait statistics with count and signal time
A smaller result makes the important columns easier to compare. Total wait time includes signal wait time. Subtracting signal time gives the displayed resource-wait component. Neither component alone proves the cause of a slowdown.
SELECT TOP (10) wait_type, waiting_tasks_count, wait_time_ms,
       signal_wait_time_ms,
       wait_time_ms - signal_wait_time_ms AS resource_wait_time_ms
FROM sys.dm_os_wait_stats
WHERE waiting_tasks_count > 0
ORDER BY wait_time_ms DESC, wait_type;
Consider repeated small waits and a few long waits separately. Parallel workers can contribute waits concurrently, so their accumulated time need not match wall-clock duration. Compare symptoms, workload volume and changes during a meaningful interval.
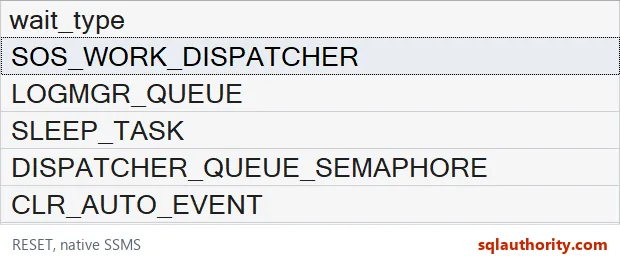
The native result below shows five names from one real snapshot. It preserves only the wait-type column for legibility. It does not show their counts or durations. Those names cannot establish a current bottleneck.
Record when the observation was collected
Save the capture time alongside the SQL Server start time. Startup establishes one useful boundary for many cumulative counters. A manual wait-counter reset can establish a later boundary. Start time alone cannot reveal every intervening reset.
SELECT SYSDATETIME() AS captured_at, sqlserver_start_time
FROM sys.dm_os_sys_info;
For interval analysis, collect complete snapshots before and after a representative period. Match wait types before subtracting counters. Reject intervals that cross a restart, counter reset or untrusted capture. This article intentionally performs no counter reset.
Snapshot times do not make separate DMV reads an atomic transaction. Keep collection close together and preserve the raw observations. Describe the sampling method when reporting interval changes. Avoid presenting a lifetime ranking as a measured incident interval.

Check present blocking separately
Accumulated lock waits and locks observed later describe different times and scopes. This read-only request query helps investigate what exists now. It cannot reconstruct an earlier blocking chain.
SELECT session_id, status, wait_type, wait_time,
       blocking_session_id
FROM sys.dm_exec_requests
WHERE session_id <> @@SPID
  AND blocking_session_id <> 0
ORDER BY wait_time DESC, session_id;
An empty result means this sample found no matching request visible to the caller. It does not prove blocking never occurred. Negative blocker identifiers have special meanings. Investigate those meanings before treating every value as a session to terminate.
Background waits and permissions change the interpretation
Long CLR_AUTO_EVENT waits are normal background behavior. Investigate the application symptom before reacting to that total. A familiar wait name is not a diagnosis.
SQL Server 2019 and earlier generally require VIEW SERVER STATE for these server observations. SQL Server 2022 and later use VIEW SERVER PERFORMANCE STATE, or VIEW SERVER STATE, which includes it. Restricted visibility can change what the caller sees. Azure products have separate permission and scope rules.
Take two snapshots and compare them, and the numbers start to mean something.
A wait total is not a diagnosis, it is a clue about where to look next.
Published by Pinal Dave on SQLAuthority. More of my work at pinaldave.com.
Discover more from SQL Authority with Pinal Dave
Subscribe to get the latest posts sent to your email.



2 Comments. Leave new
Hi Pinal,
I have run the query
SELECT *
FROM sys.dm_os_wait_stats
ORDER BY wait_time_ms DESC
GO
and I got at top 1
wait_type waiting_tasks_count wait_time_ms max_wait_time_ms signal_wait_time_ms
LCK_M_U 38421007 6485427256 22393179 19923667
I have also checked in sys.dm_tran_locks
then it will show all the sessions with “s” requeset mode with ‘Grant ‘ request state.
What’s meaning of that, what should i need to check?
Hi Pinal,
I ran the query
SELECT *
FROM sys.dm_os_wait_stats
order by wait_time_ms desc
The results are as follows:
The top wait type was CLR_AUTO_EVENT
waiting_task_count = 6781
Wait_time_ms = 14257201750
Max_wait_time_ms = 83705968
Signal_wait_time_ms = 59234
Thank you
Steven