I choose between STDEV and STDEVP according to what the readings represent. A sample and a complete population answer different questions. Both functions express spread in the original measurement’s units, which makes interpretation easier.

Make the observations explicit
The first group contains two, four, four and six, plus one missing reading. The second group has one known four. The third contains only a missing value. All inputs have an explicit decimal type.
I show COUNT of the reading beside both deviation columns. That count describes known observations rather than all source rows. A missing reading doesn’t become zero. The duplicate four remains a separate observation, because the query doesn’t request DISTINCT.
WITH Readings AS
(
 SELECT GroupId, CAST(Reading AS decimal(9,2)) AS Reading
 FROM (VALUES
  (1,2),(1,4),(1,4),(1,6),(1,CAST(NULL AS int)),
  (2,4),(2,CAST(NULL AS int)),
  (3,CAST(NULL AS int))
 ) v(GroupId,Reading)
)
SELECT GroupId, COUNT(Reading) AS ObservedCount,
       CAST(STDEV(Reading) AS decimal(12,6)) AS SampleDeviation,
       CAST(STDEVP(Reading) AS decimal(12,6)) AS PopulationDeviation
FROM Readings
GROUP BY GroupId
ORDER BY GroupId;
Interpret spread in useful units
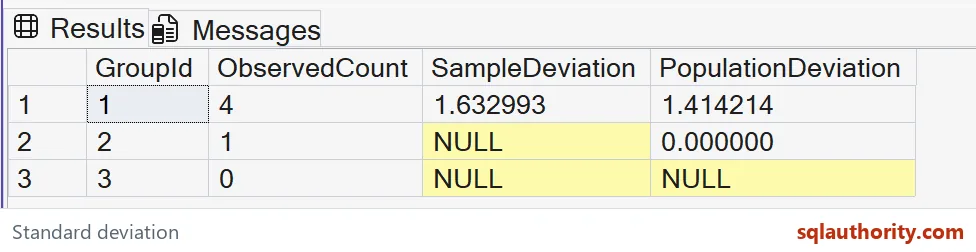
The first group’s mean is four. Its squared deviations sum to eight across four observations. The population deviation is the square root of eight divided by four. The displayed result rounds to 1.414214.
The sample deviation uses three in that denominator before taking the square root. Its displayed result rounds to 1.632993. These are analytical expectations for the fixed inputs. If readings are measured in minutes, both deviations are also expressed in minutes.
Choose the population deliberately
STDEVP describes the supplied values as the population. STDEV supports the sample interpretation. Choosing between them requires knowing whether the data represent every member of the population under discussion.
A table containing every collected record isn’t automatically the complete population of interest. It may contain only sampled days or selected customers. I’d define the population in the report’s wording first. Then choose the aggregate that matches that definition.

Read small groups honestly
The second group has one known observation. Its expected population deviation is zero, because that supplied population has no spread. Its sample deviation is NULL. There isn’t enough information for that sample calculation.
The third group has no known observations. Both expected deviations are NULL. I’d preserve those states in a chart or export instead of replacing everything with zero. Zero spread and unavailable spread communicate different facts about the readings.
Make output rounding explicit
Both functions return float, even though the input readings use decimal. The example casts each result to decimal(12,6) for a clear display contract. That cast doesn’t change the aggregate’s internal numeric category.
I’d retain appropriate precision for the report’s purpose. Six places are useful for this small comparison, but may overstate a rough measurement’s quality. The source instrument and sampling method establish meaningful precision. Extra displayed digits don’t improve the underlying observations.
Validate all groups together
The query creates no objects and uses no stored data. GroupId fixes the result order. Compare all three rows, including observation counts and each NULL, when validating the output.
I wouldn’t select the smaller number simply because it makes a dashboard look steadier. The sample or population contract comes first. Standard deviation also doesn’t diagnose why variation occurred. Use the measure to describe spread, then investigate causes with the relevant operational context.
Know who is in the data before you pick the formula.
STDEV is not a safer STDEVP, it is the answer for a sample.
Published by Pinal Dave on SQLAuthority. More of my work at pinaldave.com.
Discover more from SQL Authority with Pinal Dave
Subscribe to get the latest posts sent to your email.