
I have always wondered how Sherlock Holmes cracked the toughest of mysteries every single time. This fascination always lead me to learn new techniques every single time. The backbone for every successful detective is to be logical in their approach while working on the case. While watching movies, I have always seen a twist in the plot always makes the movie interesting and we are glued to the seat. If there is no drama, high octane action, restrictions – the movie would be boring. These techniques apply to real life too.
Being an application developer can always be demanding. You never know what situations we will get pushed into the next day. Here is one such situation which was just like a detective work. Once I was called for performance tuning exercise of our application that was running healthy for more than a year. The distress call from the customer got me thinking. What could have gone wrong in the application? Why all of a sudden this is happening? Did we release any upgrade or update to the database in the recent past as release? None of these were making sense as I kept thinking about possible root cause analysis. As soon as I landed at the customer site, I starting my interrogation with the DBA.
Pinal: Hello Sir!
DBA: Hi Pinal. Nice to see you here. Thanks for making time.
Pinal: It is a pleasure. I am surprised I had to come in such a short notice. Something must be really wrong then.
DBA: Yes. Our application users are complaining of very bad performance of your application for the past 2 weeks.
Pinal: Was it running fine before that?
DBA: I think, it must have been. They haven’t complained about it for more than a year. This seems to be a recent phenomenon. I think the application data must have increased considerably for this behavior.
Pinal: Hmmm … How is it possible that the application data increased all of a sudden in the past 2 weeks?
DBA: I am not sure. You are the expert. I am just a DBA and not an application developer. Must be something in your code.
Pinal: Can I get a chance to see the server console once?
DBA: Well, you know we are very sensitive with data privacy. I can surely get you access to an SSMS console. That must not be a problem.
Pinal: I can’t see the server even once?
DBA: Wait, let me get you the network / systems admin for this. They must know a way out.
After sometime, I get a chance to meet the Systems admin and continue the conversation.
Pinal: Hi there!
Admin: Hi. How can I be of help?
Pinal: I was wondering, if I can get access to the SQL Server box for my application?
Admin: Well, it is against our policy to open up the server directly. But what do you want to do?
Pinal: Ok. I am not sure what is going wrong on your server. Our application was running fine till about 2 weeks back. And now users are complaining about slowness in performance. I wanted to know what has changed in this timeframe all of a sudden.
Admin: Oh yeah, I forgot to tell you. We are in the process of doing server consolidation and are moving lot of our workloads from Physical to Virtual environment. And I know, we did move your database into a virtual environment.
Pinal: Cool. Are the configurations same as you moved these servers?
Admin: We made sure they are identical. So please don’t worry Pinal. It is something about your application code mostly.
Pinal: hmmm … Sure let me check. Thanks for your time.
I have always been a believer, accept but validate. There is nothing that can confirm your hypothesis but by doing the analysis all by yourself. So I bid a goodbye to Systems Admin and started my conversation with the DBA. I turned around and asked – “What do you use to monitor your SQL Server environments my friend?” He suggested the use of Spotlight on SQL Server for SQL Server. I felt so relieved that they had something.
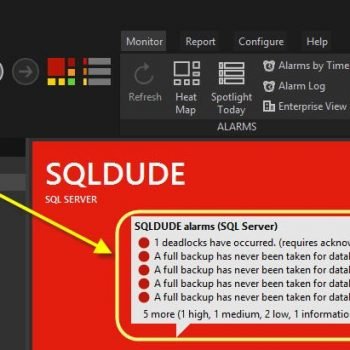
Spotlight on SQL Server for SQL Server to the rescue
Having some monitoring tool is essential when working with SQL Server. Though there are a number of them, I had had my opportunity to look at Spotlight on SQL Server in detail in the past. It surely has come a long way and has nifty features that are worth a note.
In our conversation above, I was sure there was something fishy about the configuration the Systems Admin have given to SQL Server and I wanted to understand what are the complete Hardware Configuration for our database server.
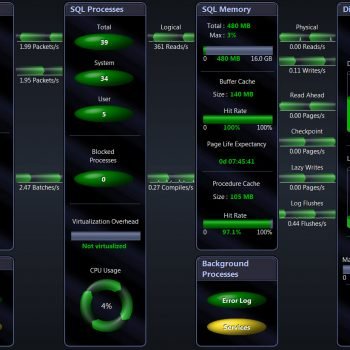
The first report I pulled out as part of my diagnosis was “Hardware Configurations”. Voila, I had my answers right in front of my eyes and I was delighted my work was complete in less than 15 mins within the organization.

In the previous configuration (physical configuration), they used an 8 Processor machine for the application’s database server. As part of the consolidation, the network team accidentally made it a single CPU machine and it deprived the application of essential CPU cycles. So in a single click I was able to get the answers. I didn’t look further because all the physical hardware configurations were in black-and-white in this dashboard for me.
In fact, if we use the SQL Server Management studio’s dashboard we can get limited information. But nothing as exhaustive as what I got to see as part of data collection on Spotlight on SQL Server. The Server Dashboard does have the “# of CPU’s” values embedded into the report.

Conclusion
A lot of times we get misdirected with the problem in hand. These take us into a spin of wrong diagnosis. Don’t always work on the symptoms of the problem. Try to find out all the data points that lead to the problem and work your way out in solving the same. In our above example, the problem was never about performance of our applications. It was about wrong configuration and wrong migration done by the network team. It is essential we are aware of these pitfalls.
Try Spotlight on SQL Server free for 30 days!
Spotlight on SQL Server continues to break new ground when it comes to providing DBAs with the ultimate in flexibility to suit their specific needs. Building on the success of the Wait Stat analysis workflow, Spotlight on SQL Server version 11.0 now includes multi-dimensional workload analysis to provide maximum insight into performance issues, an enhanced mobile capability to remotely diagnose issues directly from mobile phones and the introduction of SNMP traps. A fresh new look provides simple to use, powerful visualization to effectively monitor the health of your SQL Server environment.
If you’re looking for additional help on how to optimize your SQL Servers, Visit Dell Software’s SQL Server Resource Center for video, guides and other useful content.
Reference: Pinal Dave (https://blog.sqlauthority.com)


3 Comments. Leave new
Hi Pinal,
I have installed this tool and ran in my local SQL instance..didn’t go thru thouroughly yet but I like the details? before I suggest it to my managers I want to know the burden it gives on my servers? Is it same as SQL profiler which makes the server slow when it is running? what are the requirements of this tool to run all time in the server?
Pinal, the company I work for uses Foglight from Quest. Could you demonstrate how your article here could apply to Foglight? Thanks!