Recently when I was busy working on my next course for Pluralsight, one of my friend pinged me for some help over messenger. And the conversation went on a different spin, here is a gist of what we talked and I felt this was worth a share –
Me: Hi buddy, what’s up?
Jim: Dave, I have an unique problem and thought you can help me.
Me: Sure, let me know how I can be of help.
Jim: I am going on a quick consulting assignment tomorrow and I am wanting some helping hand.
Me: Hmmm … Sure, let me know what the problem is?
Jim: This customer has a lot of deadlock and blocking problem. And I wanted to know if you know any easy steps to find blocking queries in a real time system?
Me: Hold on let me check.
Jim: Sure.
Me: Ahha … Did you check my script available over my blog?
Jim: Awesome, Pinal I think you saved me a day. And apologize for not doing a quick search over your blog. But Pinal, I have one doubt.
Me: On the script?
Jim: No Pinal, the script was written 4 years back and is still a gold mine to help me tomorrow. I am just curious, have you ever explored any alternatives? I am sure your exploration wouldn’t have stopped.
Me: Well Jim, there are a number of other scripts but the one of the hidden gem I don’t think I have written over this blog is around Activity Monitor.
Jim: Oh is it? Can you show me what you are saying?
We get over a screen sharing and I show couple of neat tricks available with Activity Monitor. Let me take a moment to pen down what I showed Jim yesterday.
The quickest way to initialize the Activity monitor is to use the shortcut (CTRL+ALT+A) inside Management studio or feel free to read this blog on where to find the Activity Monitor.
Activity monitor to identify Blocking
The activity monitor has a number of tabs and the tab under question is the “Processes” tab. If you have a blocking scenario then activity monitor can be really a quick solution.
In the image below, we can see SPID of 51 is head of the Blocker and SPID of 55 is waiting for locks to be released by 51. We can also find the wait time, resource wait type and more from this screen.

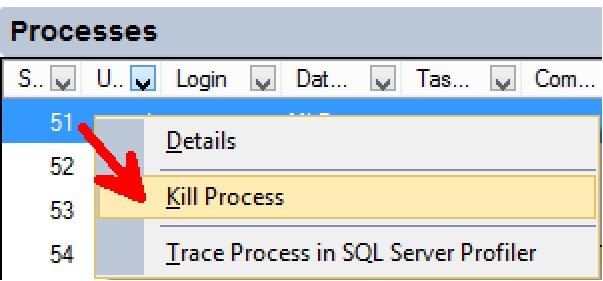
As a DBA if you want to kill SPID 51, we can quickly do that from Activity monitor using the right click menu as:

When I showed this to Jim, he was super excited to see and was all awe of what we can do just with SQL Server Management Studio. So Jim quizzed me to show him one more tip using Activity monitor as a challenge. Since he was going for a performance troubleshooting exercise, I thought of sharing one more cooler tip using the Activity monitor.
Activity monitor to find execution plans of expensive queries
I asked Jim how he would find out if there are performance problems for a given query. The obvious answer as an expert was to use an execution plan. The problem of such an approach is that when the query executed with parameters, then when we pull them out from Profiler or other mechanisms based on Reads, Write or CPU usage – the parameters need to be replaced, executed and then we need to view the execution plan.
Interestingly, Activity monitor has an interesting tab called as “Recent Expensive Queries”. These are queries based on Reads, CPU, writes etc. Once you get into this screen, right click the query under question and select “Show Execution Plan”.

End of the screen sharing exercise and about 10 mins of quick talk with me, Jim was super excited and said he will ping me once the assignment is over and how he used some of the tips I shared with him.
Activity Monitor is an awesome hidden gem inside SQL Server Management studio that many fail to use for quick monitoring. Hope this blog post inspired some of you to use it in your environments in the future. Do let me know if you ever used Activity monitor in these ways.
Reference: Pinal Dave (https://blog.sqlauthority.com)


8 Comments. Leave new
Awesome as usual:)
Thank You Sir…
Hi,
I can see the recent expensive queries.But I do not see any proc name under which those queries are running.
Hello Sir,
Really a Great post, like you said Activity Monitor is an awesome hidden gem!!!
Thanks.
Training my fingers to automatically reach for CTRL+ALT+A now….
Hello Pinal,
Thank you very much for the blog! It has answered one of my serious concerns of upgrading the SQL 2000 server, which I am managing, to SQL 2012. The Current Activity pages in SQL 2000 are my major tool for monitoring the deadlocks. I am glad that Activity Monitor can do the trick after reading and trying it out…only one last thing: how can I, or can I expand the pane of the Processes tab so that I can see as many processes as possible?
Many thanks in advance!
Yvonne
@Yvonne, I didn’t understand your question. Is that something you want as enhancement in Activity Monitor? If yes, please feel free to write to SQL Server Product team as feedback on https://docs.microsoft.com/en-us/collaborate/connect-redirect
Seeing the expensive queries, I definitely see a couple that need to be improved. So how can I find where these queries are running from, to actually correct them?