The plan properties window is where an execution plan stops being a picture and starts being evidence. The graph shows the shape. The properties show how many rows really flowed, how often, and whether SQL Server guessed well.

Why the picture is not enough
A colleague sends a plan screenshot and says the Sort is the problem, because it has the biggest percentage. That percentage is a share of the estimated cost. It is not time, and it is not a measurement. Before you agree, open the properties.
Here is a tiny table to practice on. Nothing in it is real, and it lives in tempdb only for this session.
DROP TABLE IF EXISTS #Sales;

CREATE TABLE #Sales (Id int PRIMARY KEY, CategoryId int, Amount decimal(18,2));

INSERT #Sales VALUES (1, 1, 10.00), (2, 1, 20.00), (3, 2, 30.00);
Capture one actual plan and open the window
In SSMS, turn on Include Actual Execution Plan (Ctrl+M) and run the query. Open the Execution Plan tab and click an operator. Press F4 to open the Properties window. If you hover instead, you only get a small tooltip with half the story.
SELECT CategoryId, SUM(Amount) AS TotalAmount
FROM #Sales
GROUP BY CategoryId
ORDER BY CategoryId;
Categories 1 and 2 both total 30.00. Now click the Sort operator.
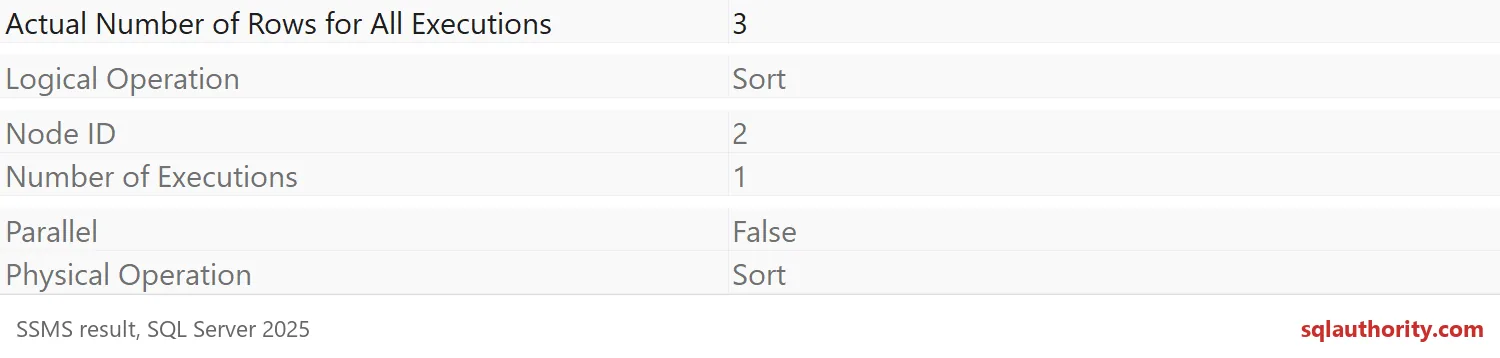
The Sort handled 3 actual rows, ran once, and was not parallel. Now click the Stream Aggregate that sits above it.
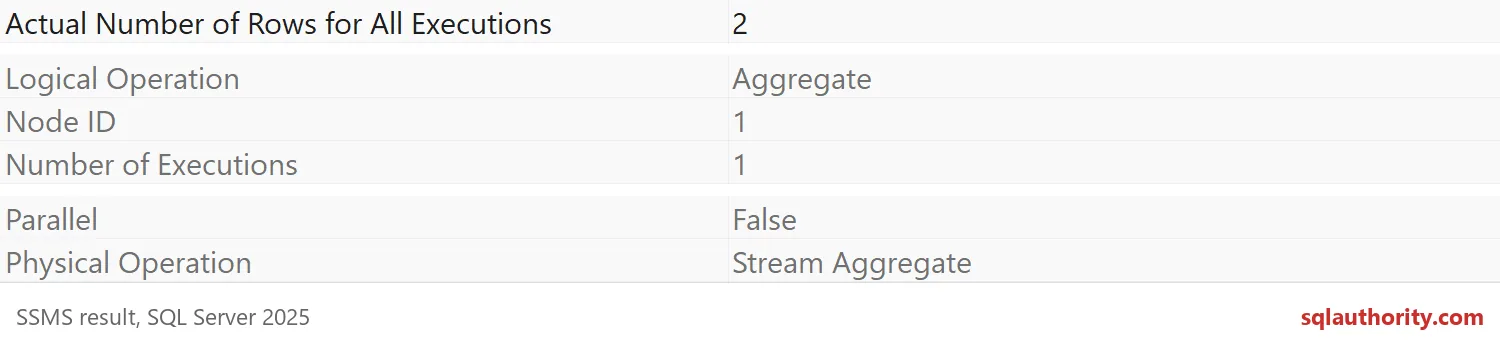
It returned 2 rows, one per category. Three rows went in and two came out. That is the story of this query, told in two numbers.
Why is there a Sort at all?
The table is stored in Id order, but the query groups by CategoryId. A Stream Aggregate wants its input already in CategoryId order, so SQL Server sorts the three rows first. The graph hints at this. The properties confirm it.
If you prefer text to clicking, SET STATISTICS PROFILE prints the same plan as rows. Look at the Rows and Executes columns for the actual numbers.
SET STATISTICS PROFILE ON;

SELECT CategoryId, SUM(Amount) AS TotalAmount
FROM #Sales
GROUP BY CategoryId
ORDER BY CategoryId;

SET STATISTICS PROFILE OFF;
The Clustered Index Scan and the Sort each report 3 rows, and the Stream Aggregate reports 2. Same numbers as the screenshots, different window.
Compare estimated rows with actual rows
The most useful habit is to put the estimate next to the actual. Here is a table where one category owns 900 of 1,000 rows. The query asks for that category through a local variable, which hides the value from the optimizer at compile time.
DROP TABLE IF EXISTS #Orders;

CREATE TABLE #Orders (Id int PRIMARY KEY, CategoryId int NOT NULL, Amount decimal(18,2) NOT NULL);

INSERT #Orders (Id, CategoryId, Amount)
SELECT TOP (1000) n, CASE WHEN n <= 900 THEN 1 ELSE 2 + n % 10 END, 10
FROM (SELECT ROW_NUMBER() OVER (ORDER BY (SELECT NULL)) AS n
      FROM sys.all_objects AS a CROSS JOIN sys.all_objects AS b) AS x
ORDER BY n;

CREATE INDEX IX_Orders_Category ON #Orders (CategoryId);
DECLARE @Category int = 1;
SET STATISTICS PROFILE ON;
SELECT COUNT(*) AS OrderCount
FROM #Orders
WHERE CategoryId = @Category;
SET STATISTICS PROFILE OFF;The count is 900. On the Index Seek row, Rows says 900 but EstimateRows says about 91. SQL Server expected a typical category, not the giant one. In the graphical plan this is the gap between Estimated Number of Rows and Actual Number of Rows in the operator properties.
One bad guess is not a crime. But it is where you look first, because the choices above that operator were made with the wrong number.

Read the statement and the warnings
Click the root SELECT operator too. It can show memory grant details, the degree of parallelism, and parameter values, when the plan has them. Compare what was requested with what was used before you call any number big. An estimated plan has no actual rows at all, so always capture the actual one when you can.
When you find something odd, save the plan with the query. Next month, you will not remember what the parameters were.
DROP TABLE IF EXISTS #Orders;
DROP TABLE IF EXISTS #Sales;
Next time someone sends you a plan picture, ask for the properties too.
A plan picture is not an explanation, it is a starting point for execution evidence.
Published by Pinal Dave on SQLAuthority. More of my work at pinaldave.com.
Discover more from SQL Authority with Pinal Dave
Subscribe to get the latest posts sent to your email.