Triangular joins match every row to all the rows before it, so a small table quietly turns into a lot of work. The final result looks tiny, which is exactly why people miss the cost.

Why a triangular join looks innocent
Picture a junior DBA who needs a running balance for a payments report. The query is short: join the table to itself, keep the rows where the other Id is smaller or equal, and add up the amounts. It returns one tidy row per payment. Nobody worries.
The trouble is hiding between the join and the GROUP BY. Before the sum happens, SQL Server pairs each row with every earlier row. The grouped result tells you nothing about how many pairs it had to build first.
Watch the pairs appear
Start with four payments of 10, 20, 30 and 40. The first query lists the pairs. Row 1 pairs with itself. Row 4 pairs with rows 1, 2, 3 and 4. That is 10 pairs for 4 rows.
Then I add up the amounts two ways: with the self join and with a window sum. Both return 10, 30, 60 and 100.
DROP TABLE IF EXISTS #Payments;
CREATE TABLE #Payments (Id int PRIMARY KEY, Amount decimal(12,2));
INSERT #Payments VALUES (1, 10), (2, 20), (3, 30), (4, 40);

SELECT a.Id, b.Id AS EarlierId
FROM #Payments AS a
JOIN #Payments AS b ON b.Id <= a.Id
ORDER BY a.Id, b.Id;

SELECT COUNT_BIG(*) AS PairCount
FROM #Payments AS a
JOIN #Payments AS b ON b.Id <= a.Id;

SELECT a.Id, SUM(b.Amount) AS JoinBalance
FROM #Payments AS a
JOIN #Payments AS b ON b.Id <= a.Id
GROUP BY a.Id
ORDER BY a.Id;

SELECT Id, SUM(Amount) OVER (ORDER BY Id ROWS UNBOUNDED PRECEDING) AS WindowBalance
FROM #Payments
ORDER BY Id;

DROP TABLE #Payments;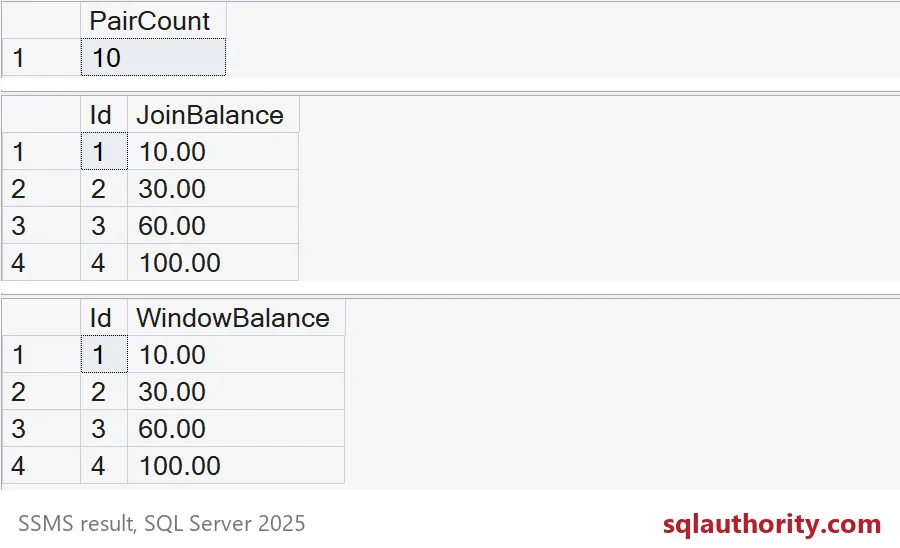
The grids show the count of 10 and two identical sets of balances. The join did 10 pieces of work to give you 4 answers. The window sum keeps a running total as it walks the rows in order, so it never builds the pairs at all.
Double the rows, quadruple the pairs
Ten pairs is nothing. The real problem is the growth. For n rows the join builds n times (n plus 1) divided by 2 pairs. That is a square, not a straight line.
This block loads 1,000 rows, then counts the pairs for the first 250, 500 and all 1,000. Each time the rows double, the pairs multiply by about four.
DROP TABLE IF EXISTS #Numbers;
CREATE TABLE #Numbers (Id int PRIMARY KEY, Amount decimal(12,2));

INSERT #Numbers (Id, Amount)
SELECT TOP (1000) ROW_NUMBER() OVER (ORDER BY (SELECT NULL)), 10
FROM sys.all_objects AS x
CROSS JOIN sys.all_objects AS y;

SELECT t.InputRows, COUNT_BIG(*) AS PairCount
FROM (VALUES (250), (500), (1000)) AS t (InputRows)
JOIN #Numbers AS a ON a.Id <= t.InputRows
JOIN #Numbers AS b ON b.Id <= a.Id
GROUP BY t.InputRows
ORDER BY t.InputRows;

DROP TABLE #Numbers;
You get 31,375 pairs, then 125,250, then 500,500. A table of one million rows would need about 500 billion. That is the moment the nightly report starts missing its window, and nobody can say what changed, because the query text never did.

Ties can change the answer
A rewrite is only a rewrite if the answers match. Here two payments share the same date, and the join says “earlier or equal date.” That counts both of them as peers.
DROP TABLE IF EXISTS #Sales;
CREATE TABLE #Sales (Id int PRIMARY KEY, SaleDate date, Amount decimal(12,2));
INSERT #Sales VALUES
    (1, '2026-01-01', 10), (2, '2026-01-02', 20),
    (3, '2026-01-02', 30), (4, '2026-01-03', 40);

SELECT a.Id, SUM(b.Amount) AS JoinBalance
FROM #Sales AS a
JOIN #Sales AS b ON b.SaleDate <= a.SaleDate
GROUP BY a.Id
ORDER BY a.Id;

SELECT Id,
       SUM(Amount) OVER (ORDER BY SaleDate, Id ROWS UNBOUNDED PRECEDING) AS RowsBalance,
       SUM(Amount) OVER (ORDER BY SaleDate) AS DefaultBalance
FROM #Sales
ORDER BY Id;

DROP TABLE #Sales;
The join gives rows 2 and 3 the same balance, 60. The window with ROWS and a tie-breaker gives 30 and 60. The window with no frame spelled out behaves like the join and also gives 60 to both. Same table, three ideas of “so far.”
So before you swap a join for a window, decide what a tie should do. Then write that rule down in the ORDER BY and the frame. Test it with duplicate dates, negative amounts and an empty table.
When the join is still the right tool
I am not saying every inequality join is a crime. A running total wants a window. The previous row wants LAG. But matching a payment to the price that was valid on that date is a genuine range question, and a join answers it well.
To check your own server, turn on SET STATISTICS IO, run the join and the window version, and compare the reads. Do it at your real table size, not four rows. Your numbers will differ from mine.
Next time a running total feels slow, count the pairs before you blame the server.
A small result is not small work, it is what is left after the pairs are built.
Published by Pinal Dave on SQLAuthority. More of my work at pinaldave.com.
Discover more from SQL Authority with Pinal Dave
Subscribe to get the latest posts sent to your email.