A weighted average needs each group’s contribution, not only its displayed mean. I retain the total and populated-value count before combining groups. Giving every group equal weight answers a different question when their populations differ.

Compare groups with different populations
Group A contains readings ten and twenty. Its mean is fifteen across two populated values. Group B contains ninety and a missing reading. Its mean is ninety across one populated value.
Group C has one missing reading and no populated values. Keeping it exposes the difference between input rows and contributing values. COUNT star reports its one row. COUNT of Reading reports zero contributing values.
All populated inputs are explicitly decimal values. The displayed totals and means use decimal with three fractional places. This keeps integer division outside the comparison. No table setup or session change is required.
WITH Inputs AS
(
    SELECT GroupCode, Reading
    FROM (VALUES
        (CAST('A' AS varchar(1)), CAST(10 AS decimal(10,2))),
        ('A', 20), ('B', 90), ('B', NULL), ('C', NULL)
    ) AS v(GroupCode, Reading)
)
SELECT GroupCode, COUNT(*) AS InputRows, COUNT(Reading) AS PresentValues,
       CAST(SUM(Reading) AS decimal(12,3)) AS GroupTotal,
       CAST(AVG(Reading) AS decimal(12,3)) AS GroupMean
FROM Inputs
GROUP BY GroupCode
ORDER BY GroupCode;
Choose what receives equal weight
Averaging fifteen and ninety gives 52.5. That calculation assigns one contribution to each populated group mean. The two-value group and one-value group receive equal weight. It doesn’t reconstruct the average across the individual readings.
The complete populated values are ten, twenty and ninety. Their total is 120 and their population is three. Dividing that total by three gives forty. The grouped reconstruction should match the direct AVG over those values.
I’d choose the mean of group means if equal group influence were the stated requirement. That can be a deliberate reporting policy. Calling it the average reading would hide a different population. The correct choice depends on the quantity being reported.
WITH Inputs AS
(
    SELECT GroupCode, Reading
    FROM (VALUES
        (CAST('A' AS varchar(1)), CAST(10 AS decimal(10,2))),
        ('A', 20), ('B', 90), ('B', NULL), ('C', NULL)
    ) AS v(GroupCode, Reading)
), Groups AS
(
    SELECT GroupCode, SUM(Reading) AS GroupTotal,
           COUNT(Reading) AS PresentValues, AVG(Reading) AS GroupMean
    FROM Inputs
    GROUP BY GroupCode
)
SELECT CAST(AVG(GroupMean) AS decimal(12,3)) AS MeanOfGroupMeans,
       CAST(SUM(GroupTotal) / NULLIF(CAST(SUM(PresentValues) AS decimal(12,3)), 0)
            AS decimal(12,3)) AS WeightedMean,
       CAST((SELECT AVG(Reading) FROM Inputs) AS decimal(12,3)) AS DirectMean,
       SUM(PresentValues) AS PresentValues
FROM Groups;
Use the count that produced each mean
AVG ignores NULL readings. Its denominator therefore follows populated values, not every source row. Weighting group B by its two input rows would use a different denominator. Keep the aggregate’s count alongside its total.
A missing reading isn’t a numeric zero. Substituting zero before averaging would change the group mean and the contributing population. That policy needs explicit approval in the report definition. This query leaves both missing readings untouched.
Group C’s total and mean remain NULL. Its populated-value count is zero. It adds no populated contribution to the reconstructed mean. Its existence still matters when separately reporting how much data was unavailable.
Keep an all-missing population visible
The final query selects only group C. It still has one input row, but no populated reading. Both reconstructed and direct means should remain NULL. A zero mean would assert an available numeric result that these inputs don’t supply.
WITH Inputs AS
(
    SELECT GroupCode, Reading
    FROM (VALUES
        (CAST('A' AS varchar(1)), CAST(10 AS decimal(10,2))),
        ('A', 20), ('B', 90), ('B', NULL), ('C', NULL)
    ) AS v(GroupCode, Reading)
)
SELECT COUNT(*) AS InputRows, COUNT(Reading) AS PresentValues,
       CAST(SUM(Reading) / NULLIF(CAST(COUNT(Reading) AS decimal(12,3)), 0)
            AS decimal(12,3)) AS ReconstructedMean,
       CAST(AVG(Reading) AS decimal(12,3)) AS DirectMean
FROM Inputs
WHERE GroupCode = 'C';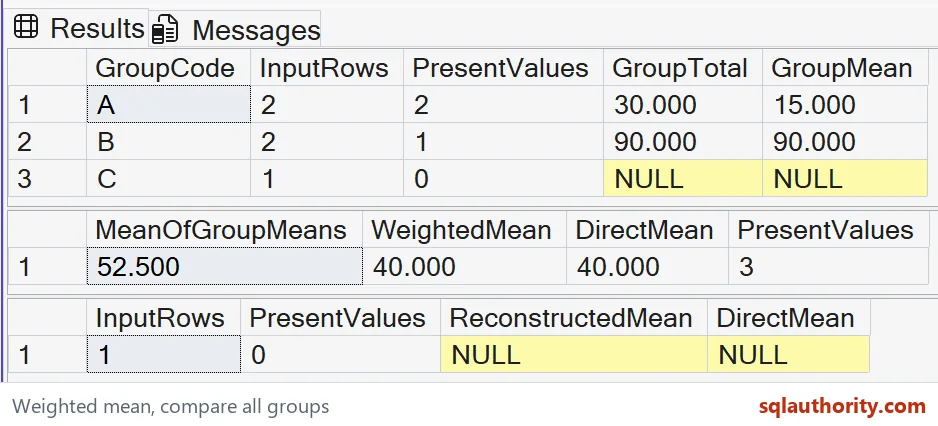
NULLIF turns a zero denominator into NULL. That prevents the division from claiming a numeric outcome for an empty contributing population. It doesn’t invent a replacement reading. Keep a missing-result policy separate from the arithmetic.
Preserve enough information to combine summaries
Save group totals and contributing counts when later reports need a combined mean. Multiplying a rounded display mean by its count can introduce another approximation. Totals preserve the contribution before that display rounding. This example reconstructs from the totals directly.
The selected values fit the decimal casts and int counts used here. Large totals or populations need suitable aggregate and destination types. The same population rule still applies after widening them. A larger type doesn’t repair an incorrect weight.
These groups partition the supplied rows without overlap. Combining overlapping summaries would count some values more than once. Compare the grouped reconstruction with the complete source population when that source remains available. Keep the reporting grain beside every saved summary.

Save the totals and the counts, and any group can be combined later.
A mean of means is not the mean of values, it is one equal vote per group.
Published by Pinal Dave on SQLAuthority. More of my work at pinaldave.com.
Discover more from SQL Authority with Pinal Dave
Subscribe to get the latest posts sent to your email.