
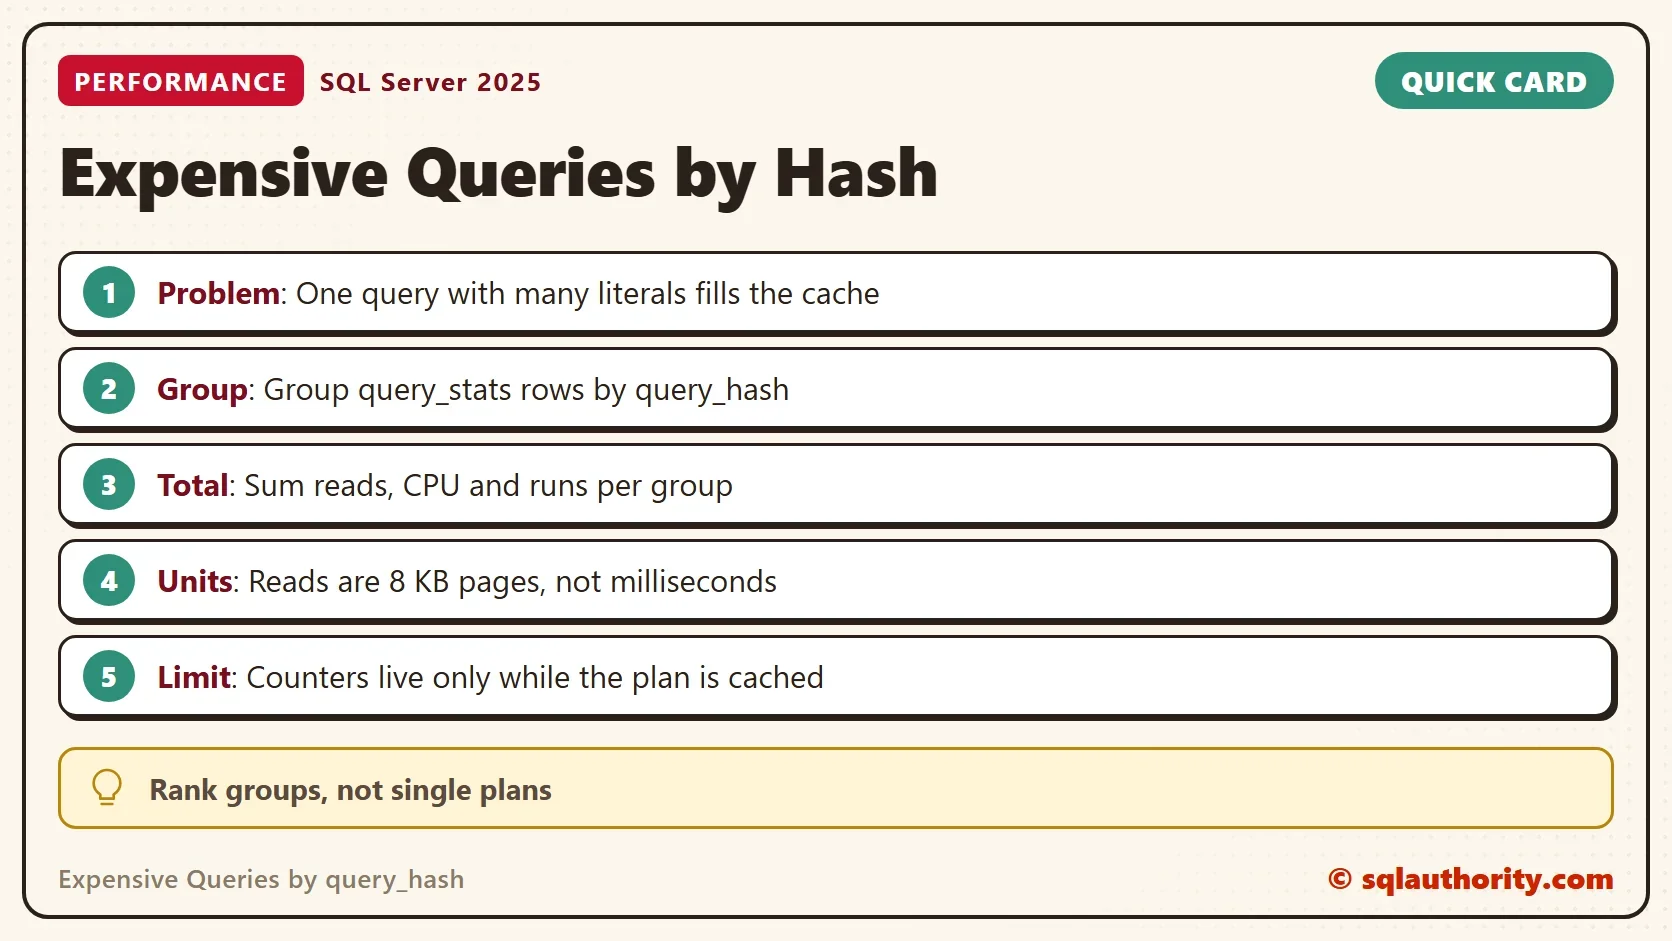
Expensive queries by query_hash means grouping every cached plan of the same statement, so that you see its total cost. A ranking of single plans misses a query that runs with many different literals. Each value leaves a small plan, and no single plan looks expensive.

Why One Plan Misleads
To find expensive queries by query_hash, start with the view sys.dm_exec_query_stats, which keeps one row per cached plan. An ad hoc statement that carries a literal, such as a customer number, gets a plan for each value. All those plans share one query_hash, which is a hash of the statement text without its literals. The classic list of expensive queries ranks the rows and never adds the plans up. Together, the small plans can cost more than your slowest report.
The demo creates a database named QueryHashDemo with 200,000 orders and an index on the customer. The workload runs a lookup for 40 different customers, 25 times each, and runs one scan five times. SQL Server parameterizes a statement on its own only when the plan is trivial. This aggregate with a key lookup is not trivial, so each literal keeps its own plan. The hint MAXDOP 1 only keeps the plans serial. Run it on a test server.
IF DB_ID(N'QueryHashDemo') IS NULL CREATE DATABASE QueryHashDemo;
GO
USE QueryHashDemo;
GO
DROP TABLE IF EXISTS dbo.Orders;
CREATE TABLE dbo.Orders (OrderID int NOT NULL CONSTRAINT PK_Orders PRIMARY KEY, CustomerID int NOT NULL, Total decimal(10,2) NOT NULL, Note char(100) NOT NULL DEFAULT 'x');
INSERT INTO dbo.Orders (OrderID, CustomerID, Total)
SELECT TOP (200000) n, n % 2000, 10
FROM (SELECT ROW_NUMBER() OVER (ORDER BY (SELECT NULL)) AS n FROM sys.all_objects AS a CROSS JOIN sys.all_objects AS b CROSS JOIN sys.all_objects AS c) AS t;
CREATE INDEX IX_Orders_Customer ON dbo.Orders (CustomerID);
SET NOCOUNT ON;
DECLARE @c int = 0, @r int, @sql nvarchar(400);
WHILE @c < 40
BEGIN
    SET @c += 1;
    SET @r = 0;
    SET @sql = N'DECLARE @x decimal(18,2); SELECT @x = SUM(Total) FROM dbo.Orders WHERE CustomerID = ' + CAST(@c AS nvarchar(10)) + N' OPTION (MAXDOP 1); -- lookup';
    WHILE @r < 25 BEGIN EXEC (@sql); SET @r += 1; END;
END;
SET @r = 0;
WHILE @r < 5
BEGIN
    EXEC (N'DECLARE @y decimal(18,2); SELECT @y = SUM(Total) FROM dbo.Orders WHERE Note = ''x'' OPTION (MAXDOP 1); -- scan');
    SET @r += 1;
END;
The List of Single Plans
The query below ranks the cached plans of the demo by logical reads. Logical reads count 8 KB pages that a plan touched, so they measure the work. The filter on the plan attribute dbid keeps the list to the current database. The filter on the text keeps it to the demo statements.
SELECT TOP (3) qs.execution_count AS Runs, qs.total_logical_reads AS TotalReads,
       SUBSTRING(st.text, CHARINDEX(N'WHERE', st.text), 30) AS QueryPart
FROM sys.dm_exec_query_stats AS qs
CROSS APPLY sys.dm_exec_sql_text(qs.sql_handle) AS st
CROSS APPLY sys.dm_exec_plan_attributes(qs.plan_handle) AS pa
WHERE pa.attribute = N'dbid' AND pa.value = DB_ID() AND st.text LIKE N'%FROM dbo.Orders WHERE%' AND st.text NOT LIKE N'%dm_exec_query_stats%'
ORDER BY qs.total_logical_reads DESC;| Runs | TotalReads | QueryPart |
|---|---|---|
| 5 | 15690 | WHERE Note = ‘x’ OPTION (MAXDO |
| 25 | 8070 | WHERE CustomerID = 34 OPTION ( |
| 25 | 8070 | WHERE CustomerID = 11 OPTION ( |
The scan is on top with 15,690 reads. The lookups follow with 8,070 reads each, and they tie, so the customers that appear can differ on your run. By this list the scan is the most expensive query, and the lookups look minor. That ranking is the trap.
Expensive Queries by query_hash: Group the Plans
Now group the same rows by query_hash. The query adds the runs, counts the cached plans, and sums reads, CPU and the megabytes read. The variable at the top chooses the ranking: reads, CPU, elapsed time, or the number of runs.
DECLARE @by varchar(10) = 'reads';
SELECT TOP (3)
       SUM(qs.execution_count) AS Runs,
       COUNT(*) AS CachedPlans,
       SUM(qs.total_logical_reads) AS TotalReads,
       CAST(SUM(qs.total_logical_reads) * 8 / 1024.0 AS decimal(14,1)) AS TotalReadMB,
       CAST(SUM(qs.total_worker_time) / 1000.0 AS decimal(14,1)) AS CpuMs,
       MIN(LEFT(st.text, CHARINDEX(N'WHERE', st.text) + 4)) AS QueryStart
FROM sys.dm_exec_query_stats AS qs
CROSS APPLY sys.dm_exec_sql_text(qs.sql_handle) AS st
CROSS APPLY sys.dm_exec_plan_attributes(qs.plan_handle) AS pa
WHERE pa.attribute = N'dbid' AND pa.value = DB_ID() AND st.text LIKE N'%FROM dbo.Orders WHERE%' AND st.text NOT LIKE N'%dm_exec_query_stats%'
GROUP BY qs.query_hash
ORDER BY CASE @by WHEN 'reads' THEN SUM(qs.total_logical_reads)
                  WHEN 'cpu' THEN SUM(qs.total_worker_time)
                  WHEN 'elapsed' THEN SUM(qs.total_elapsed_time)
ELSE SUM(qs.execution_count) END DESC;| Runs | CachedPlans | TotalReads | TotalReadMB | CpuMs | QueryStart |
|---|---|---|---|---|---|
| 1000 | 40 | 321975 | 2515.4 | 329.3 | DECLARE @x decimal(18,2); SELECT @x = SUM(Total) FROM dbo.Orders WHERE |
| 5 | 1 | 15690 | 122.6 | 553.9 | DECLARE @y decimal(18,2); SELECT @y = SUM(Total) FROM dbo.Orders WHERE |
Ranked by reads, the lookups come first now. One statement ran 1,000 times through 40 cached plans and read 321,975 pages, which is about 2.5 GB. The scan read 15,690 pages. Ranked by CPU, the scan still leads, with 553.9 ms against 329.3 ms. Set @by to ‘cpu’ to see it. Pick the resource that hurts, then tune the leader. An index that covers the lookup would cut the reads by a large factor. One parameterized query that reuses a plan would cut the 40 cached plans to one.
Read the columns this way. Runs and CachedPlans together show how scattered a statement is. A high plan count for one hash points at literals in the text. TotalReadMB turns pages into megabytes, since one page is 8 KB. A column label that says milliseconds for reads would mislead, so the query names the unit. The column QueryStart shows the start of the batch text. On a real server with multi statement batches, use statement_start_offset and statement_end_offset to cut out the statement. CpuMs is the worker time in milliseconds.
When to Run It and What It Cannot Tell You
The counters start when a plan enters the cache, and they disappear when the plan leaves. A restart, a memory squeeze or a recompile resets them. Run the query when users complain, or after a busy day, and not at midnight on a quiet server. A single run is a snapshot, so repeat it to see the trend. The view needs the VIEW SERVER STATE permission, which is VIEW SERVER PERFORMANCE STATE on SQL Server 2022 and later.
For your own server, remove the two filters on the statement text. Keep the filter on the database, or take it out to see the whole instance. The post Find the Most Resource Intensive Queries in SQL Server ranks single plans by CPU, reads and runs. It complements this grouped view.
Is Query Store Better?
You could argue that Query Store does this better, because it keeps history across restarts. It does, and it must be switched on first, and it only knows the time since then. The grouping query works on any server today, with no setting. I use it for the first look and Query Store for the history.
What to Remember
Expensive queries by query_hash are the queries ranked by their total cost, not by their single plans. Group on the hash, sum the reads and the CPU, and read the plan count. Reads are pages, so multiply by 8 KB. The counters live only while the plan is cached, so run the query while the problem is current.
When you finish, run the cleanup script. It removes the demo database.
USE master;
GO
ALTER DATABASE QueryHashDemo SET SINGLE_USER WITH ROLLBACK IMMEDIATE;
DROP DATABASE QueryHashDemo;
An expensive query is not the slowest, it is the one that costs most in the resource you pick.
Published by Pinal Dave on SQLAuthority. More of my work at pinaldave.com.
Discover more from SQL Authority with Pinal Dave
Subscribe to get the latest posts sent to your email.




3 Comments. Leave new
Hi Pinal,
I’m confused when you divide qs.total_logical_reads by 1000, and alias the column with “ms” included, which suggests milliseconds. I can see doing that for qs.total_worker_time and qs.total_elapsed_time, but the number of logical reads is not a measure of time.
Not really a big deal, but something I have started doing when I get the SQL Text from DMVs is convert it to XML. That way you can click on it and preview it easier.:
, CAST(” AS xml) AS [Complete Query Text]
how often should this be run or is it one time?