You can watch a running query in Activity Monitor, and a live execution plan shows how far it has got. The steps below use SSMS 22. A T-SQL query at the end reads the same facts.

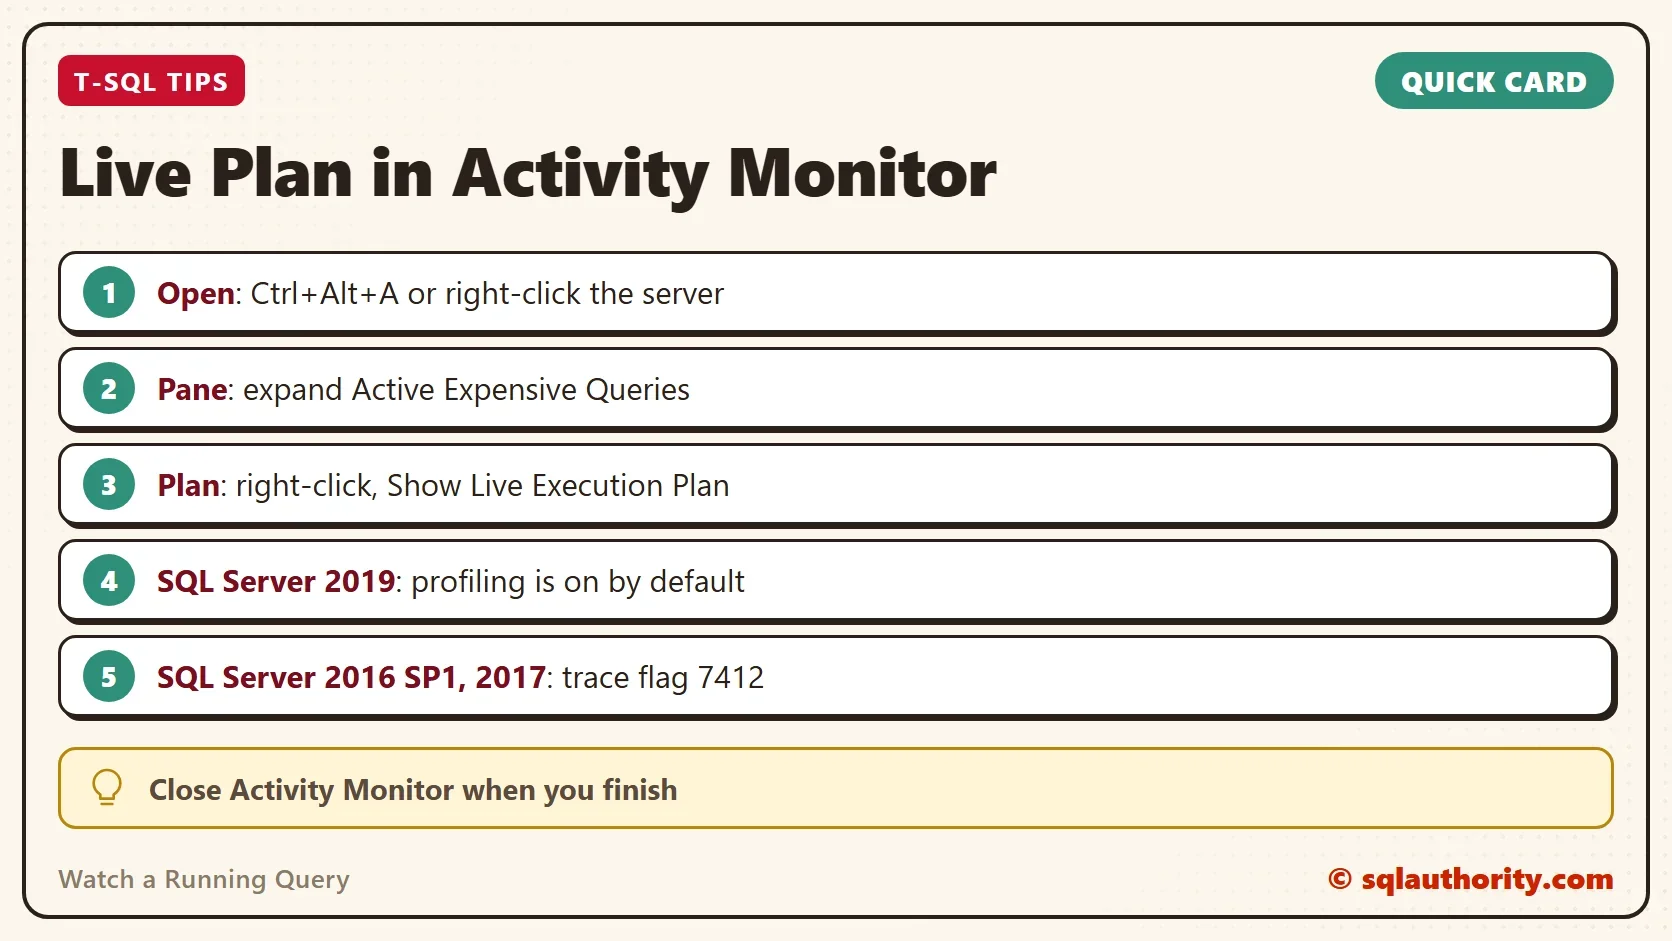
Open Activity Monitor
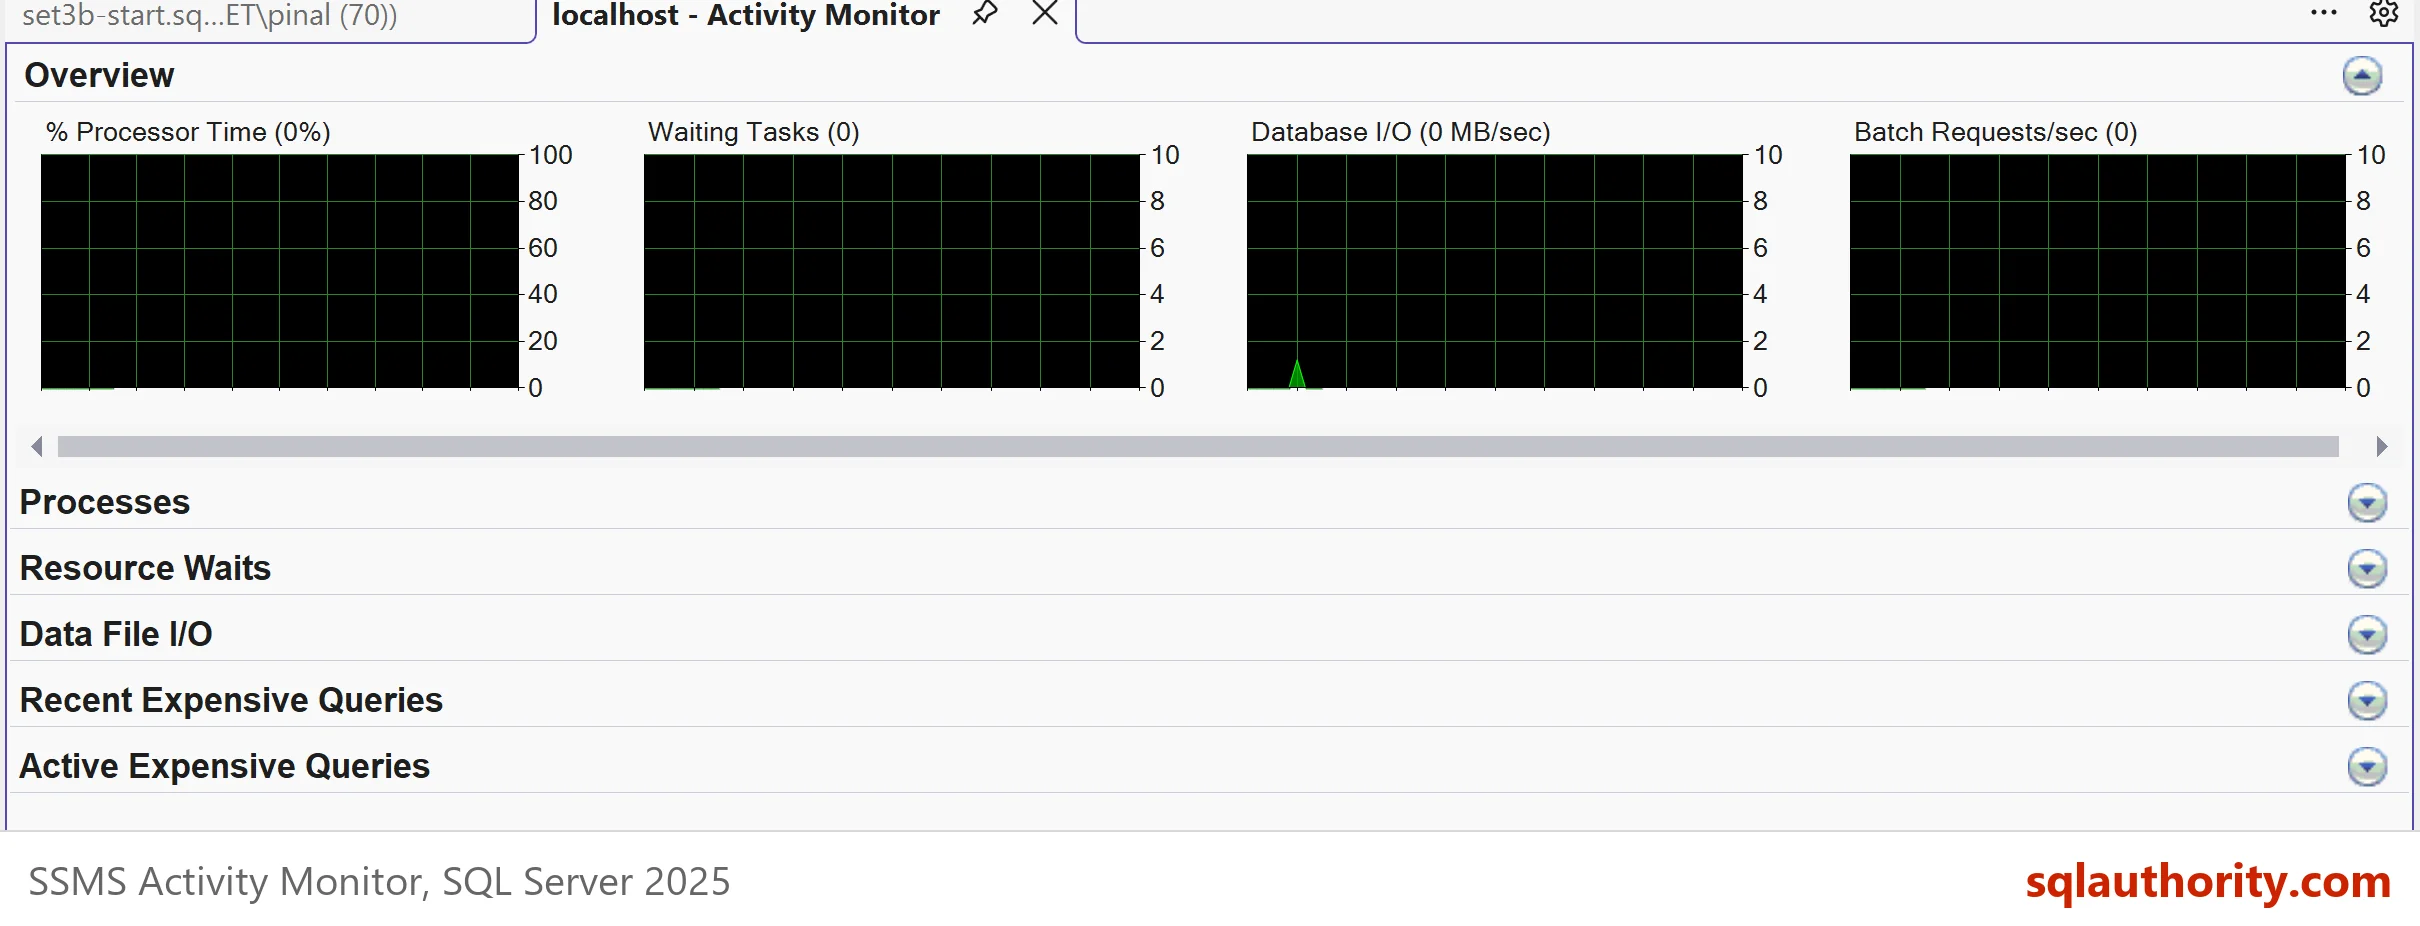
Connect to the server in Object Explorer, right-click the server name, and choose Activity Monitor. The shortcut is Ctrl+Alt+A. A tab opens with a graph panel on top and five collapsed panes below it. The panes are Processes, Resource Waits, Data File I/O, Recent Expensive Queries and Active Expensive Queries.
Your login needs the VIEW SERVER STATE permission. On SQL Server 2022 and later, VIEW SERVER PERFORMANCE STATE is enough. Without it, Activity Monitor cannot show what the server is doing.
Find the Running Query
Expand Active Expensive Queries. The pane lists the queries that are running right now, with columns for CPU, reads and writes. It differs from Recent Expensive Queries, which looks back at queries that already finished. A busy server fills the list quickly, so sort by the CPU column to find the heaviest one.
The pane refreshes on a timer. The default is every 10 seconds. To change it, right-click the Overview graph and pick a new interval under Refresh Interval. A short interval keeps the list fresh and puts more load on the server, since every refresh runs queries there.
Show the Live Execution Plan
To watch a running query as it works, right-click it and choose Show Live Execution Plan. A new tab opens with the plan of that query. The arrows move while the query runs, and each operator shows how many rows it has produced so far. Compare that count with the estimate under the operator. An operator far past its estimate deserves a look.
The menu item works only when SQL Server collects run time statistics for the query. SQL Server 2019 does that by default. The script below creates the demo database for the T-SQL part. It also runs two statements that confirm profiling on your server.
IF DB_ID(N'ActivityQueryDemo') IS NULL CREATE DATABASE ActivityQueryDemo;
GO
USE ActivityQueryDemo;
GO
DROP TABLE IF EXISTS dbo.Visits;
CREATE TABLE dbo.Visits (VisitID int NOT NULL PRIMARY KEY, Bucket int NOT NULL);
WITH n AS (
    SELECT TOP (400000) ROW_NUMBER() OVER (ORDER BY (SELECT NULL)) AS k
    FROM sys.all_objects AS a CROSS JOIN sys.all_objects AS b CROSS JOIN sys.all_objects AS c
)
INSERT INTO dbo.Visits (VisitID, Bucket) SELECT k, k % 400 FROM n;
GO
SELECT name, value FROM sys.database_scoped_configurations WHERE name = N'LIGHTWEIGHT_QUERY_PROFILING';
DBCC TRACESTATUS (7412);| name | value |
|---|---|
| LIGHTWEIGHT_QUERY_PROFILING | 1 |
A value of 1 means lightweight profiling is on, and the trace flag status 0 is fine on this version. SQL Server 2016 SP1 and 2017 have no such setting. There, turn on trace flag 7412 for the whole server before the menu item works. This changes a server setting, so test it first and write down the undo.
DBCC TRACEON (7412, -1);
-- Undo: DBCC TRACEOFF (7412, -1);
Read the Same Facts With T-SQL
Activity Monitor is a window over dynamic management views. You can query them yourself. The demo needs two query windows. Window 1 starts a query that runs for 30 seconds. It counts the same rows in a loop, and it stops on its own.
USE ActivityQueryDemo;
GO
DECLARE @end datetime2 = DATEADD(SECOND, 30, SYSDATETIME()), @n bigint = 0;
WHILE SYSDATETIME() < @end
    SET @n += (SELECT COUNT(*) FROM dbo.Visits WHERE Bucket = 7);
SELECT @n AS RowsCounted;
While window 1 runs, run this in window 2. It lists every other request in the demo database, with its CPU time, reads and the statement that is running.
SELECT r.session_id, r.status, r.cpu_time AS CpuMs, r.logical_reads AS LogicalReads,
       r.total_elapsed_time / 1000 AS ElapsedSeconds,
       SUBSTRING(t.text, r.statement_start_offset / 2 + 1,
                 (CASE r.statement_end_offset WHEN -1 THEN DATALENGTH(t.text) ELSE r.statement_end_offset END - r.statement_start_offset) / 2 + 1) AS CurrentStatement
FROM sys.dm_exec_requests AS r
CROSS APPLY sys.dm_exec_sql_text(r.sql_handle) AS t
WHERE r.session_id <> @@SPID AND r.database_id = DB_ID(N'ActivityQueryDemo');| session_id | status | CpuMs | LogicalReads | ElapsedSeconds | CurrentStatement |
|---|---|---|---|---|---|
| 75 | running | 5106 | 175869 | 5 | SET @n += (SELECT COUNT(*) FROM dbo.Visits WHERE Bucket = 7) |
This table is one sample, taken five seconds after window 1 started. Your session number and counters will differ, and they grow while the query runs. When no other query is running, the result is empty. That is the answer you get after window 1 ends.
The live plan has a DMV of its own. sys.dm_exec_query_profiles returns one row per operator of a running query. Its row_count column is the number you see under each operator in the live plan. Replace 75 with the session_id from the previous query.
SELECT p.session_id, p.node_id, p.physical_operator_name, p.row_count
FROM sys.dm_exec_query_profiles AS p
WHERE p.session_id = 75;
| session_id | node_id | physical_operator_name | row_count |
|---|---|---|---|
| 75 | 2 | Stream Aggregate | 0 |
| 75 | 3 | Clustered Index Scan | 114 |
Run it a few times. Each pass of the loop restarts the scan, so the count climbs from zero again and again. The function sys.dm_exec_query_statistics_xml goes one step further. It returns the whole plan with the run time numbers filled in. SSMS draws that plan as the live view.
Close It When You Finish
I do not use Activity Monitor as my main tool for tuning. I depend on the DMVs, because a query can be saved, changed and run again. You could argue that a window beats a script when a server is on fire. You want an answer in seconds, and it gives one. The cost is that the window keeps polling the server until you close it. On a production server that adds up.
Open it, find the query, copy what you need, and close the tab. When you finish the T-SQL demo, drop the database.
USE master;
GO
ALTER DATABASE ActivityQueryDemo SET SINGLE_USER WITH ROLLBACK IMMEDIATE;
DROP DATABASE ActivityQueryDemo;
What to Remember
To watch a running query, open Activity Monitor and expand Active Expensive Queries. Right-click the query and choose Show Live Execution Plan. SQL Server 2019 has the needed profiling on. SQL Server 2016 SP1 and 2017 need trace flag 7412. The same facts come from sys.dm_exec_requests and sys.dm_exec_query_profiles.
Activity Monitor is not a tuning tool, it is a window onto the queries that are running right now.
Published by Pinal Dave on SQLAuthority. More of my work at pinaldave.com.
Discover more from SQL Authority with Pinal Dave
Subscribe to get the latest posts sent to your email.