CUBE requests every grouping combination of its dimensions, including independent subtotals and the grand total. I compare its output population with ROLLUP before choosing it. More subtotal families are useful only when the report needs them.
With two dimensions, the combinations are both dimensions, each dimension alone, and neither dimension. Those are four grouping sets, not four output rows. Each set can contain several groups based on the source values.

Compare the same source under two operators
The source contains North and South across Online and Store. Its four detail amounts are ten, twenty, three and seven. Together they contribute forty.
The first query uses CUBE on Region and Channel. The second uses ROLLUP in that same argument order. Both return the amount and grouping bitmap so their row populations can be compared directly.
The source dimensions are populated in this example. That keeps the focus on grouping combinations rather than stored missing values. Both queries are read-only and require no table creation or settings changes.
WITH Sales AS
(
    SELECT Region, Channel, Amount
    FROM (VALUES (CAST('North' AS varchar(10)), CAST('Online' AS varchar(10)), 10),
                 ('North', 'Store', 20), ('South', 'Online', 3), ('South', 'Store', 7)) AS v(Region, Channel, Amount)
)
SELECT Region, Channel, SUM(Amount) AS SalesAmount,
       GROUPING_ID(Region, Channel) AS GroupingId
FROM Sales
GROUP BY CUBE(Region, Channel)
ORDER BY GroupingId, Region, Channel;

WITH Sales AS
(
    SELECT Region, Channel, Amount
    FROM (VALUES (CAST('North' AS varchar(10)), CAST('Online' AS varchar(10)), 10),
                 ('North', 'Store', 20), ('South', 'Online', 3), ('South', 'Store', 7)) AS v(Region, Channel, Amount)
)
SELECT Region, Channel, SUM(Amount) AS SalesAmount,
       GROUPING_ID(Region, Channel) AS GroupingId
FROM Sales
GROUP BY ROLLUP(Region, Channel)
ORDER BY GroupingId, Region, Channel;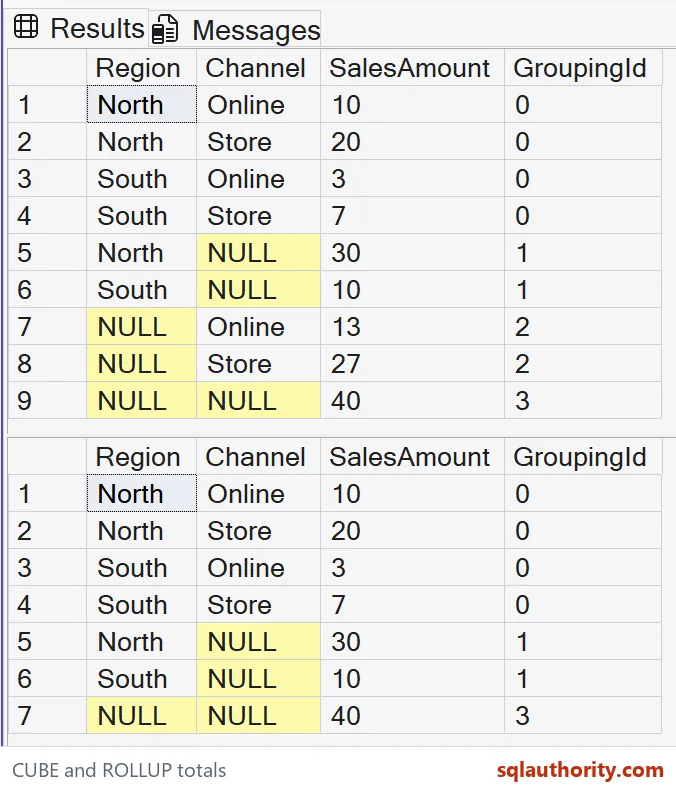
Read all nine CUBE rows
The expected CUBE result contains four detail groups. Their GroupingId is zero because both dimensions participate. These rows preserve the original region-channel combinations and their aggregated amounts.
Two region subtotals have GroupingId one. North totals thirty and South totals ten. These rows aggregate away Channel while retaining the region grouping.
Two channel subtotals have GroupingId two. Online totals thirteen and Store totals twenty-seven. These rows aggregate away Region while retaining the channel grouping.
The final grouping set produces the grand total of forty with GroupingId three. Both dimensions are aggregated away. Counting all nine output rows does not mean there were nine source records or nine independent amounts.
Why the ROLLUP result has fewer rows
The expected ROLLUP result contains seven rows. It includes the same four detail groups, two region subtotals and grand total. It does not include the channel-only subtotal family.
ROLLUP follows the hierarchy implied by its argument order. Region comes first here, so its subtotal level remains. Reversing the arguments would retain channel subtotals instead of region subtotals.
CUBE does not choose only one such hierarchy. It includes both independent subtotal families for these dimensions. That difference is the reason to choose it when a report needs both views.
I don’t describe CUBE as a shortcut that always gives a better report. Returning unneeded grouping levels can confuse the consuming application. An explicit GROUPING SETS list may fit a smaller required population better.

Control growth and interpretation
The number of grouping combinations grows as dimensions are added. The actual output row count also depends on the source groups within those combinations. Review the required levels before expanding a two-dimensional example into a wide report.
The grouping bitmap identifies a level, not a source record. Keep it available when exporting the result. Replacing placeholders with display labels should not erase that level information.
The subtotals reuse the same source amount across different grouping sets. Adding detail, region, channel and grand-total rows together would count the source repeatedly. Decide which level belongs in each downstream calculation.
This example concerns the T-SQL grouping operator, not an Analysis Services cube or a performance benchmark. It shows complete logical results from fixed inputs. Compare output population and measure definitions before investigating execution costs on larger data.
Pick the levels the report needs, and leave the rest out.
CUBE is not a better ROLLUP, it is a larger set of subtotals.
Published by Pinal Dave on SQLAuthority. More of my work at pinaldave.com.
Discover more from SQL Authority with Pinal Dave
Subscribe to get the latest posts sent to your email.