percent_complete is a column in sys.dm_exec_requests that says how far a running command has come. Some commands fill it in. Others leave it at 0 until they end. Let’s run eleven commands on SQL Server 2025 and see which group each one belongs to.

What the Column Says
The view sys.dm_exec_requests lists every request that runs right now, one row each. The column goes from 0 to 100. Next to it, estimated_completion_time counts the milliseconds SQL Server thinks are left.
A row exists only while the command runs. When the command ends, the row is gone. A 0 does not mean the command is stuck. It means SQL Server has no estimate for that command.
Build a Test Database
I ran everything here on SQL Server 2025. The first script creates a database with a 6 GB data file and a 2 GB log. Plan for about 25 GB of free disk space at the peak, backup file included.
IF DB_ID(N'ProgressDemo') IS NULL
BEGIN
    CREATE DATABASE ProgressDemo;
    ALTER DATABASE ProgressDemo SET RECOVERY SIMPLE;
    ALTER DATABASE ProgressDemo MODIFY FILE (NAME = N'ProgressDemo', SIZE = 6GB, FILEGROWTH = 512MB);
    ALTER DATABASE ProgressDemo MODIFY FILE (NAME = N'ProgressDemo_log', SIZE = 2GB, FILEGROWTH = 512MB);
END
The orders table holds 15 million rows with a 200-byte note each. It takes about 3 GB.
USE ProgressDemo;
GO
DROP TABLE IF EXISTS dbo.Orders;
CREATE TABLE dbo.Orders
(
    OrderID int NOT NULL CONSTRAINT PK_Orders PRIMARY KEY CLUSTERED,
    Customer int NOT NULL,
    Note char(200) NOT NULL
);
INSERT INTO dbo.Orders (OrderID, Customer, Note)
SELECT value, ABS(CHECKSUM(NEWID())) % 100000, REPLICATE('a', 200)
FROM GENERATE_SERIES(1, 15000000);
Two more tables help later. Archive is a spare that we drop for the shrink test. Parts starts with tiny notes, and one update widens them. That splits its pages and fragments the index.
DROP TABLE IF EXISTS dbo.Archive;
CREATE TABLE dbo.Archive (ArchiveID int NOT NULL PRIMARY KEY CLUSTERED, Note char(200) NOT NULL);
INSERT INTO dbo.Archive (ArchiveID, Note)
SELECT value, REPLICATE('z', 200) FROM GENERATE_SERIES(1, 3000000);
DROP TABLE IF EXISTS dbo.Parts;
CREATE TABLE dbo.Parts (PartID int NOT NULL CONSTRAINT PK_Parts PRIMARY KEY CLUSTERED, Note varchar(200) NOT NULL);
INSERT INTO dbo.Parts (PartID, Note)
SELECT value, 'x' FROM GENERATE_SERIES(1, 3000000);
UPDATE dbo.Parts SET Note = REPLICATE('b', 200);
Watch From a Second Window
Open a second query window on the same computer. This query lists every user request started from this computer, except itself. I ran it about three times a second while each command below ran in the first window.
SELECT r.session_id, r.command, r.percent_complete,
       r.estimated_completion_time / 1000 AS est_seconds, r.wait_type
FROM sys.dm_exec_requests AS r
JOIN sys.dm_exec_sessions AS s ON s.session_id = r.session_id
WHERE s.is_user_process = 1
  AND s.host_name = HOST_NAME()
  AND r.session_id <> @@SPID;
Two columns matter most: command and percent_complete. The wait_type column shows what the command waits for. It proves life even when the percentage does not move.
Commands That Report Progress
Start with a full backup. A bare file name goes to the default backup folder of the server.
BACKUP DATABASE ProgressDemo TO DISK = N'ProgressDemo.bak' WITH INIT;
The command column says BACKUP DATABASE. The number climbed from 0.6 to 99.9 over 35 polls, and the backup took 11.7 seconds. This is the best case.
Now restore it over the database. Run this one from master, because nobody can use the database during a restore.
USE master;
GO
RESTORE DATABASE ProgressDemo FROM DISK = N'ProgressDemo.bak' WITH REPLACE;
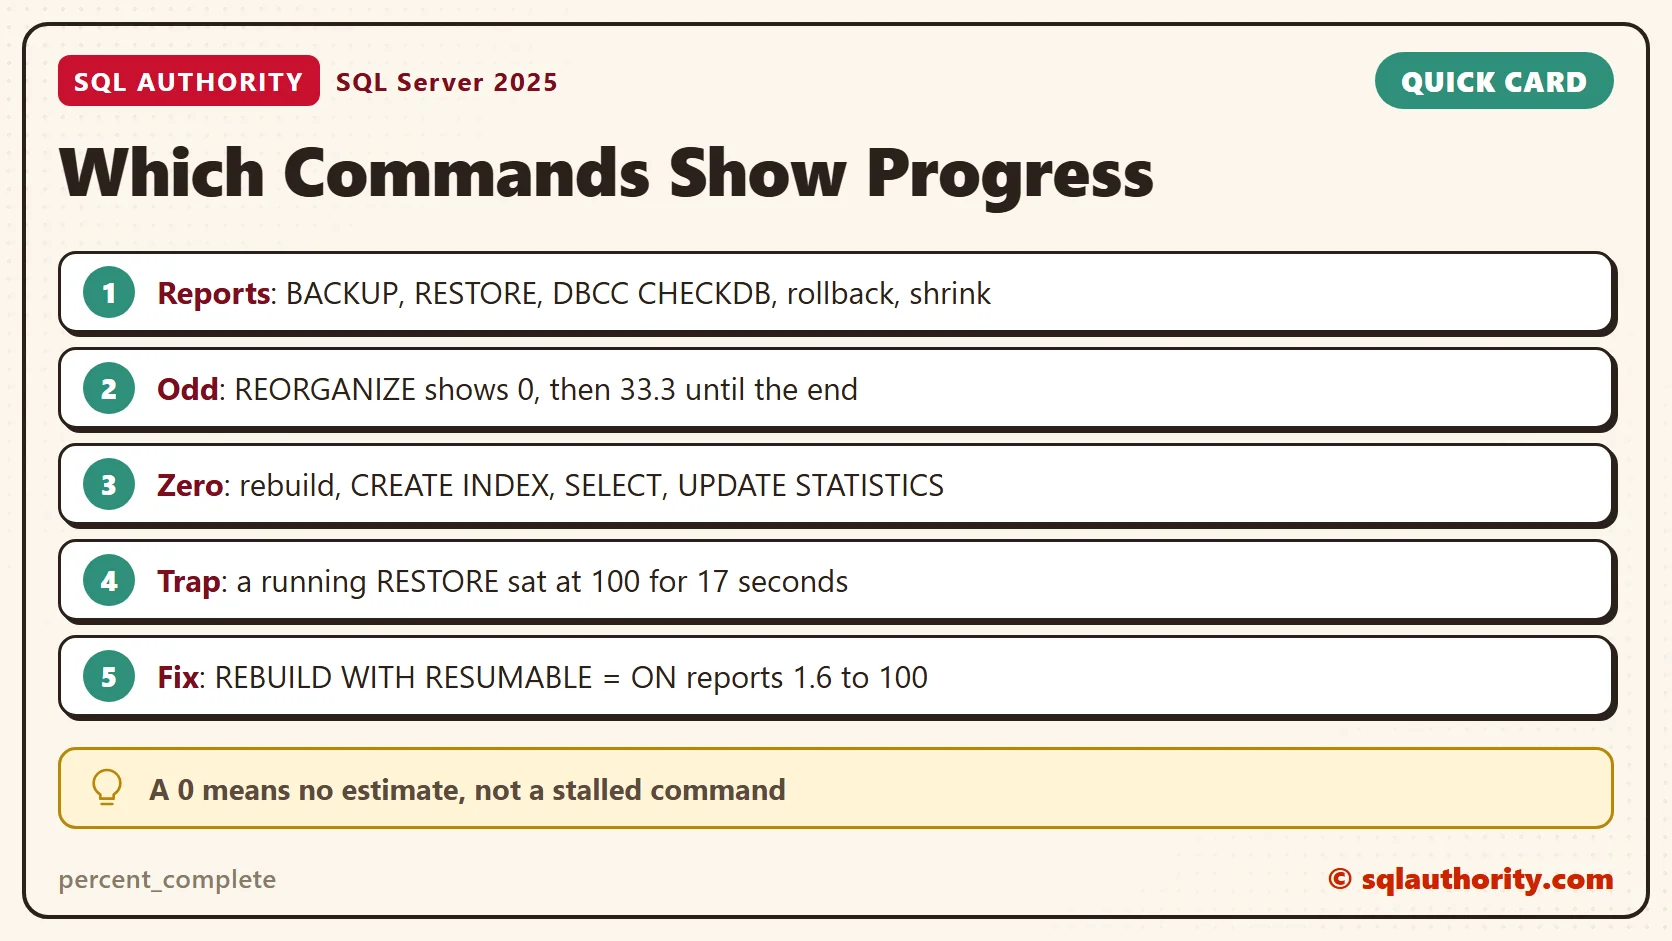
The number climbs from 0.4 to 100 in about 16 seconds. Then it stays at 100 until the command ends at 33 seconds. Half of my polls caught a running restore at 100. Read 100 as pages copied, not as finished.
DBCC CHECKDB reports too, but in phases.
DBCC CHECKDB (ProgressDemo) WITH NO_INFOMSGS;
First the command column said DBCC TABLE CHECK, and the number went from 0.08 to 99.6. Then the name changed to DBCC CHECKCATALOG, and the number fell back to 0 for the rest of the run.
Reorganizing an index is odd.
USE ProgressDemo;
GO
ALTER INDEX ALL ON dbo.Parts REORGANIZE;
The command column says DBCC, not ALTER INDEX. Across 87 polls the number had only two values. It stayed at 0 for the first 23 seconds. Then it jumped to 33.3 and stayed there until the command ended at 31 seconds. That counts as reporting, but it is a poor gauge.
A rollback reports progress too. In window 1 we open a transaction, update 4 million rows and leave it open. SELECT @@SPID in window 1 gives its session id. In window 2 we kill that session. Replace 56 with your own id.
| Window | Statement |
|---|---|
| 1 | BEGIN TRAN; UPDATE TOP (4000000) dbo.Orders SET Note = REPLICATE('b', 200); |
| 2 | KILL 56; |
The killed session shows the command AWAITING COMMAND with the status rollback. The number went from 0.2 to 98.5 in 17 seconds. KILL 56 WITH STATUSONLY says “transaction rollback in progress. Estimated rollback completion: 5%. Estimated time remaining: 13 seconds.”
Treat the time estimate as a rough guess. At the first poll, est_seconds said 27, and the rollback needed 17.
The last command in this group is a shrink. Dropping Archive leaves a gap in the middle of the file. Shrinking to 4,400 MB then has to move the Parts pages into that gap.
DROP TABLE dbo.Archive;
DBCC SHRINKFILE (N'ProgressDemo', 4400);
The command column says DbccFilesCompact. The number started at 72 and ended at 100 after about 14 seconds. I can’t explain the start at 72, but the number moved the whole way.
Commands That Stay at Zero
Now the other side. These four commands run for seconds and report nothing. A rebuild creates the whole index again.
ALTER INDEX ALL ON dbo.Orders REBUILD;
Creating a new index on the Customer column works the same way.
CREATE INDEX IX_Orders_Customer ON dbo.Orders (Customer);
A SELECT counts too. This one sorts 3 million rows, so it runs long enough to watch.
SELECT SUM(CAST(x.rn AS bigint)) FROM (SELECT ROW_NUMBER() OVER (ORDER BY Note, Customer) AS rn FROM dbo.Orders WHERE OrderID <= 3000000) AS x;
Last, a statistics update that reads every row.
UPDATE STATISTICS dbo.Orders WITH FULLSCAN;
Here is every result in one place. The poll counts come from my run, so yours will differ a little.
| Command | command column | percent_complete |
|---|---|---|
| BACKUP DATABASE | BACKUP DATABASE | 0.6 to 99.9 |
| RESTORE DATABASE | RESTORE DATABASE | 0.4 to 100, then 100 for 17 seconds |
| DBCC CHECKDB | DBCC TABLE CHECK, then DBCC CHECKCATALOG | 0.08 to 99.6, then 0 |
| ALTER INDEX REORGANIZE | DBCC | 0, then 33.3 until the end |
| Rollback after KILL | AWAITING COMMAND | 0.2 to 98.5 |
| DBCC SHRINKFILE | DbccFilesCompact | 72 to 100 |
| ALTER INDEX REBUILD | ALTER INDEX | 0 in all 22 polls |
| CREATE INDEX | CREATE INDEX | 0 in all 49 polls |
| SELECT with a sort | SELECT | 0 in all 50 polls |
| UPDATE STATISTICS | UPDATE STATISTICS | 0 in all 27 polls |
| Resumable rebuild | ALTER INDEX | 1.6 to 100 |
Making Silent Commands Talk
A resumable rebuild changes the picture. It needs ONLINE = ON, so check your edition first.
ALTER INDEX PK_Orders ON dbo.Orders REBUILD WITH (ONLINE = ON, RESUMABLE = ON);
The command column still says ALTER INDEX, but now the number moved from 1.6 to 100 over 54 polls. The same figure shows in sys.index_resumable_operations. That view exists because a resumable rebuild can pause and continue later.
A plain SELECT has no such switch, but it has another view. sys.dm_exec_query_profiles shows how many rows each operator has produced so far. Run this while the SELECT from above runs.
SELECT p.node_id, p.physical_operator_name, SUM(p.row_count) AS row_count, SUM(p.estimate_row_count) AS estimate_row_count
FROM sys.dm_exec_query_profiles AS p
JOIN sys.dm_exec_sessions AS s ON s.session_id = p.session_id
WHERE s.host_name = HOST_NAME()
  AND p.session_id <> @@SPID
GROUP BY p.node_id, p.physical_operator_name
ORDER BY p.node_id;
After half a second, the Clustered Index Seek had read all 3,000,000 rows. The Sort still showed 0 rows when the query ended 30 seconds later. So the query was not slow to read. It was busy sorting. On my instance this worked with no setup.
What About STATS?
You could say BACKUP and RESTORE already print progress with the STATS option. Fair point. That text appears only in the window that runs the command.
The DMV lets you watch a job that someone else started, or one that SQL Server Agent runs at night. It also works for commands that have no STATS option at all.
A Short Checklist
- Read command and percent_complete together, because a new command name resets the number.
- Treat a 0 as no estimate. Look at wait_type, or at sys.dm_exec_query_profiles for a SELECT.
- Treat a 100 on a restore as pages copied. Wait until the row disappears.
- Trust the numbers of BACKUP, RESTORE, CHECKDB and rollback more than the one of REORGANIZE.
- Make a rebuild resumable when you must watch it, and check that your edition supports it.
Clean Up
Drop the database and clear its backup history. SQL Server does not delete backup files, so remove ProgressDemo.bak from the default backup folder yourself.
USE master;
GO
ALTER DATABASE ProgressDemo SET SINGLE_USER WITH ROLLBACK IMMEDIATE;
DROP DATABASE ProgressDemo;
EXEC msdb.dbo.sp_delete_database_backuphistory @database_name = N'ProgressDemo';
A zero in percent_complete is not a stalled command, it is a silent one.
Published by Pinal Dave on SQLAuthority. More of my work at pinaldave.com.
Discover more from SQL Authority with Pinal Dave
Subscribe to get the latest posts sent to your email.