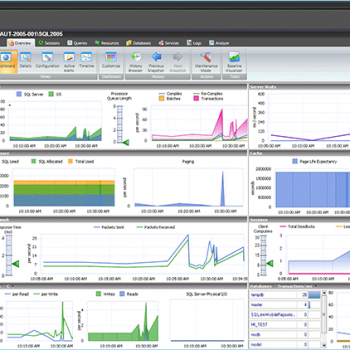
I have been fortunate to work with many organizations. One thing each organization cares about the most is the availability of the data and the performance of the system. Behind every single successful application, there is always a database. Today we are going to discuss the same topic as how we can do proactive SQL Server monitoring with IDERA’s SQL Diagnostic Manager (SQL DM).


Microsoft SQL Server supports applications that are critical to organizations where downtime and poor performance have an immediate impact on organizational productivity. In the real world, when we face performance problems, we can rarely afford the luxury of opening PowerPoint and study theory. What helps us during times of crisis are handy scripts or a tool that help us fix our performance problems.
Now this problem goes to the next level when we need to do the same on the cloud. Most cloud platforms have tools to monitor their platform. However, they do not have a tool that can monitor the application which is installed on their platform. Here is where we can get some help from SQL DM.
Many of my clients are using SQL DM for the following primary reasons to monitor data:
- Real-time monitor data for health and performance
- Monitor tempdb contention and space
- Monitor file sized at the level of the operating system on Linux and Windows
- Resource monitoring (such as CPU and memory)
- Analyze and resolve blocks and deadlocks
- Resolve performance issues under production workload
- Manage life cycles of queries (monitor, alert, and kill deadlocks)
- Find long-running queries based on execution time
I really like to monitor my multi-platform cloud environment along with my on-premises installation of applications in a single environment. That way, I can easily compare their performance and monitor them from a single view.
I believe in proactive SQL Server monitoring. If you are interested, I suggest you try out the tool SQL Diagnostic Manager.
Reference: Pinal Dave (http://blog.SQLAuthority.com)